


Welcome back to Panic Drop.
This week I am opening up the company that more of you have asked about than any other: Palantir
Palantir sells something most of its own shareholders cannot describe in a sentence, which is why the stock has spent five years being alternately worshipped and shorted by people who agree on almost nothing except that they do not really know what the company does.
That gap is the opportunity.
The question this piece answers: if you strip away the mythology, the founders and the AI narrative, what does Palantir actually sell, who actually pays for it, and is $174 a share a reasonable price for it?
Let us open the box.
What’s inside
Free half
The industry: why data integration became the bottleneck of the AI era
Company history: from fraud detection to the front lines
What Palantir actually sells (the Ontology, explained without jargon)
The business model: how the money actually arrives
Unit economics and the bootcamp flywheel
Corporate governance, insiders and the compensation question
Competitive advantages and how Palantir stacks up against peers
The financials: growth, margins, cash and the one segment nobody talks about
Premium half
Can a better AI model make the Ontology obsolete? The debate that decides everything
The dilution question: what stock based compensation really costs you
Valuation and target price for FY2027
Main risks: 5 things that would break this
The investment thesis in 4 pillars
Final thoughts and the verdict
1. The industry: why data integration became the bottleneck of the AI era
Start with a fact that sounds boring and is not.
Almost every large organisation on earth already has the data it needs to make better decisions. A hospital network knows its bed occupancy, its staffing rota, its supply levels and its patient flow. An aerospace manufacturer knows its part inventories, its supplier lead times and its production schedule. A bank knows its exposures, its counterparties and its collateral.
The problem is that this knowledge lives in 40 different systems that were bought at different times, from different vendors, by different departments, and none of them speak to each other.

So the hospital knows all 4 of those things in 4 separate places, and nobody can answer the question “given the staff we have tomorrow, how many admissions can we safely accept?” without 3 analysts and a week.
This is the enterprise software industry’s oldest problem. For 30 years the answer was some combination of data warehouses, business intelligence dashboards and consultants. You centralised the data, you built a chart, and then a human looked at the chart and made a decision.
Then generative AI arrived and changed the economics of that problem in 2 ways.
First, it raised the prize. If a machine can reason about your operations, the value of having your operations represented in a form a machine can reason about goes up enormously. A dashboard was worth what a manager could extract from it in the 10 minutes they spent looking at it. A system that can act is worth vastly more.
Second, it exposed the bottleneck. Every enterprise that ran an AI pilot in 2024 and 2025 discovered the same thing. The model was not the constraint. The model was excellent. The constraint was that the model had nothing reliable to reason over. Point a frontier model at a company’s raw databases and it will produce confident nonsense, because it does not know that “CUST_ID” in one table and “customer_number” in another refer to the same person, or that a purchase order in a certain state cannot legally be cancelled.
The industry phrase for the gap is the semantic layer. Everyone now claims to have one. Snowflake has a semantic model. Microsoft has Fabric IQ. Databricks has Unity Catalog. Salesforce has Data Model Objects.
The reason Palantir is interesting is that it built its version roughly a decade before anyone needed it, for customers who could not afford to get it wrong.
Where does value accrue in this market? Not to the model layer, which is commoditising fast and where 3 or 4 labs are in a price war. Not to raw storage and compute, which the hyperscalers have already turned into a utility. Value accrues to whoever owns the layer that sits between the 2: the representation of the business itself, and the governance over who and what is allowed to change it.
That is the layer Palantir is fighting for. Hold that thought, because it is the whole thesis.
2. Company history: from fraud detection to the front lines
Palantir was founded in 2003, which means it spent 17 years as a private company before most investors had heard of it.
The origin story matters because it explains the culture. Peter Thiel had just sold PayPal, where the survival problem had been fraud.

PayPal’s insight was that catching fraud rings required a human analyst and a machine working together: the software surfaced the patterns and the connections, and the person applied judgement to what they meant. Neither alone was good enough.
Thiel’s bet was that the same architecture would work for counterterrorism. He backed Alex Karp, a philosophy PhD with no technology background whatsoever, alongside Stephen Cohen, Joe Lonsdale and Nathan Gettings. The CIA’s venture capital arm became an early investor, and for years the intelligence community was effectively the product development partner.
The first platform was Gotham, built for defence and intelligence users. Its job was to take fragments from wildly incompatible sources, signals intelligence, human reporting, financial records, imagery, and stitch them into a single picture an analyst could interrogate.
Doing this for classified customers imposed a set of constraints that turned out to be commercially valuable later. Everything had to be auditable. Every piece of data had to carry permissions down to the individual field, because a given analyst might be cleared to see a person’s name but not their location. The software had to run inside the customer’s own environment, sometimes on networks with no internet connection at all.
Around 2016 the company took what it had learned and pointed it at industry. Foundry was the result: the same data integration and modelling machinery, aimed at manufacturers, banks, hospitals and energy companies rather than intelligence agencies.
For years this went badly. Foundry deployments were enormous, slow, expensive and staffed by armies of Palantir engineers. The company burned cash. Critics called it a consulting firm with a software multiple, and for a period that criticism was fair.
Apollo arrived to fix part of the problem: a delivery layer that lets Palantir ship software updates continuously across every environment it operates in, from public cloud to a submarine. It is invisible to customers and it is the reason the company can serve classified and commercial users from one codebase.
Palantir went public by direct listing on 30 September 2020, at roughly a $22bn valuation. It later moved its listing to Nasdaq, joined the S&P 500 in 2024 and entered the Nasdaq 100 the same year.
The inflection came in April 2023 with AIP, the Artificial Intelligence Platform. AIP connects large language models to the customer’s Foundry environment so that an AI agent can reason over the company’s actual objects and take governed actions on them.
Alongside AIP came the go to market change that mattered more than the product launch: the bootcamp. Instead of a 6 month sales cycle followed by a 12 month deployment, Palantir started running short, hands on sessions where a customer’s own engineers built a working use case on their own data in a matter of days.
Everything in the numbers you are about to see traces back to that decision.
Know someone who owns this stock and cannot explain it? This is the piece to send them.
3. What Palantir actually sells: the Ontology, explained without jargon
This is the section that exists because the company is treated as a black box. If you take 1 thing from this piece, take this.
Palantir explains it with an airline, so let us use theirs.
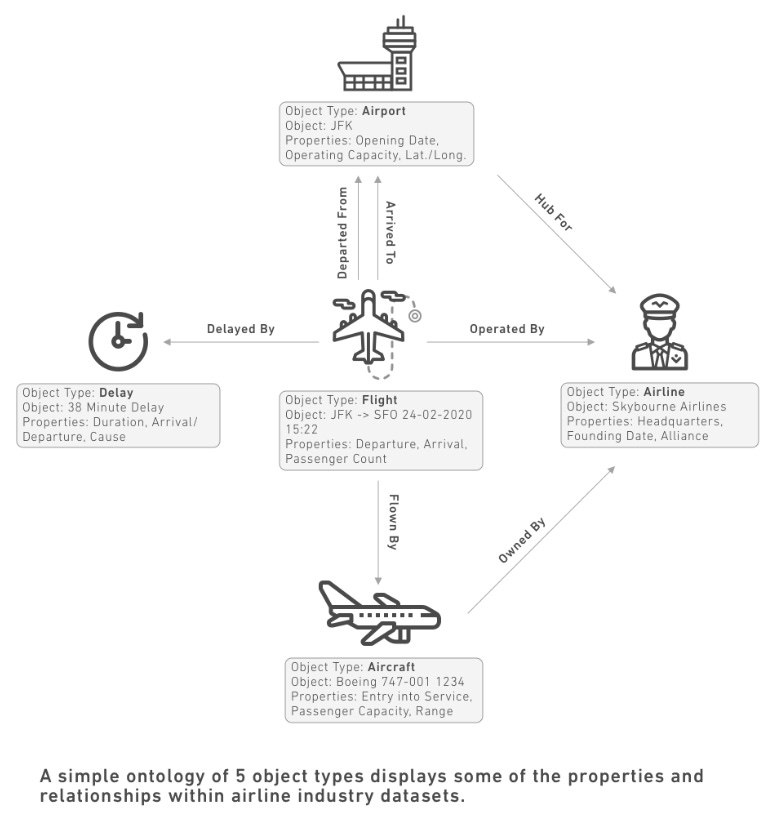
The boxes are things. A Flight. An Airport. An Aircraft. An Airline. A Delay. Each one has facts attached to it, so JFK carries its opening date, its capacity and its coordinates.
The arrows are how those things relate. Flight Departed From Airport. Flight Operated By Airline. Aircraft Owned By Airline.
That is the whole picture. Things, and how they connect.
Why it is clever.
The airline already has all this data. It sits in separate tables that do not talk to each other, joined only by ID codes an analyst has to decipher every time somebody asks a question.
The ontology does that joining once, then keeps it. So instead of writing a query, you walk the arrows. Flight to Delay to Aircraft to Airline, and you have found which airline owns the plane on the delayed flight. The path was already there.
Now look at Delay, because this is the part that makes it click.
In a normal system a delay is a number in a column. 38 minutes. That is it.
Palantir made it a thing, with its own duration, its own cause, its own identity. And because it is a thing rather than a number, you can count delays, compare them, and ask what causes them at JFK on winter Tuesdays. You cannot ask that of a number in a column.
Then it adds the piece that makes it valuable: actions.
Rebook the passengers. Reassign the aircraft. Swap the crew. Each action knows its own rules, so the system will not put an aircraft on a route beyond its range or a crew past its legal duty limit.
So the controller does not read that a flight is delayed. The controller fixes it, in the same screen, and the change writes back into the real systems with a record of who did it.
That is the difference between describing a business and running one.
And it is why AI made this suddenly valuable.
Point an AI agent at raw tables and it guesses what everything means. It guesses wrong. Point it at an ontology and it inherits a map a human already checked, plus a fixed list of things it is allowed to do, plus the same permissions that apply to staff. The agent can act, but only through approved actions. It cannot invent its own.
Palantir calls this AI sovereignty: you keep control of your data, your logic and your permissions instead of handing the keys to whichever AI lab is winning this quarter.
The analogy. Most data tools are a very good filing cabinet. This is a cockpit. The filing cabinet tells you what happened. The cockpit has instruments showing the real state of the aircraft, and controls that move the flaps.

2 honest caveats.
Your data has to be copied into Palantir’s system. It does not read your source systems where they sit. That affects cost, and it affects how easily you leave.
And the map takes work to build. 5 object types is a teaching example. A real airline has hundreds, covering maintenance, crew, fuel, pricing and regulatory reporting. Building that is what Palantir’s engineers do on site, which is why this business still has a services element. It is also exactly what makes customers stay.
Which brings us to how the money works.
4. The business model: how the money actually arrives
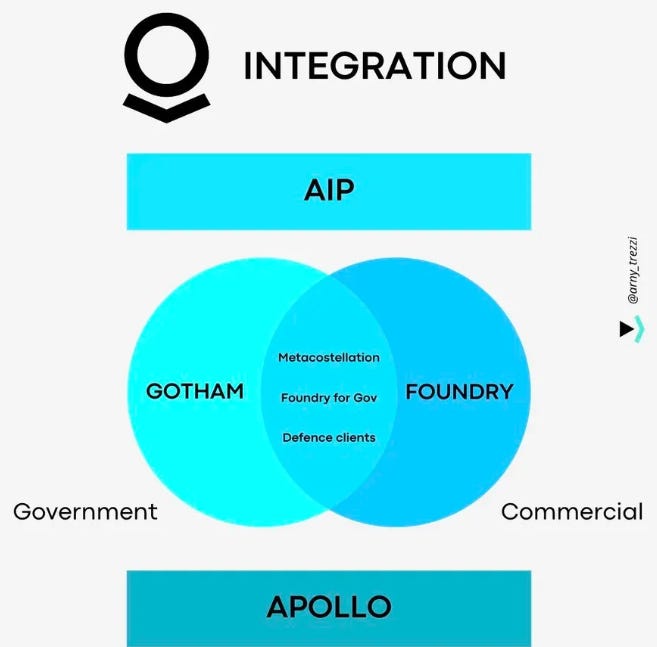
Palantir sells 4 platforms.
Gotham for defence, intelligence and national security customers
Foundry for commercial and civilian government operations
Apollo, the delivery layer that pushes software into every environment
AIP, the layer that lets models and agents work against the Ontology
Almost all new commercial business is Foundry with AIP attached. Gotham remains the anchor of the government franchise.
Pricing is where most investors get lost, so here is the mechanism.
There is no published price list. Palantir does not sell seats. It negotiates an annual platform fee per customer, sized by which platforms are in scope, how many data domains and use cases are covered, and how many people will use it. On top of that fee sits metered consumption across 3 dimensions the company actually publishes:
Compute, measured in compute seconds, covering both scheduled pipelines and interactive queries
Storage, measured in gigabyte months, for general data sitting in the transformation layers
Ontology volume, also in gigabyte months, for the indexed object data that powers the fast operational queries
That third line is the interesting one. Ontology volume is the meter that runs when the customer is genuinely operating on the platform rather than just parking data in it. It scales with usage, not with headcount, which is why a customer can double their spend without adding a single user.
Contracts are typically multiyear with annual commitments. Independent practitioners who advise on these negotiations report commercial deployments running from roughly $250,000 a year for a single narrow use case to several million for an enterprise programme, with most first contracts at large enterprises landing somewhere between $500,000 and $2m annually. Government and defence contracts run considerably larger and are partly visible in public award data.
The sales motion is acquire, expand, scale. Land small on one workflow. Prove the saving. Expand into the adjacent process. Then scale across the organisation, at which point the platform fee resets upward and consumption compounds.
Q2 2026 gives a clean illustration. Management described a multinational technology customer that started with a single operating company and expanded into a 3 year agreement worth close to $370m. A nonprofit health system converted a pilot into a 3 year partnership carrying $37m of contract value. A global asset manager signed a 3 year, $35m deal. A software and services company signed an initial $15m agreement lasting 5 months after attending one of Palantir’s Agent Camp events.
Note the shape of that last one. $15 million, 5 months, straight out of a workshop. That is not how enterprise software used to be sold.
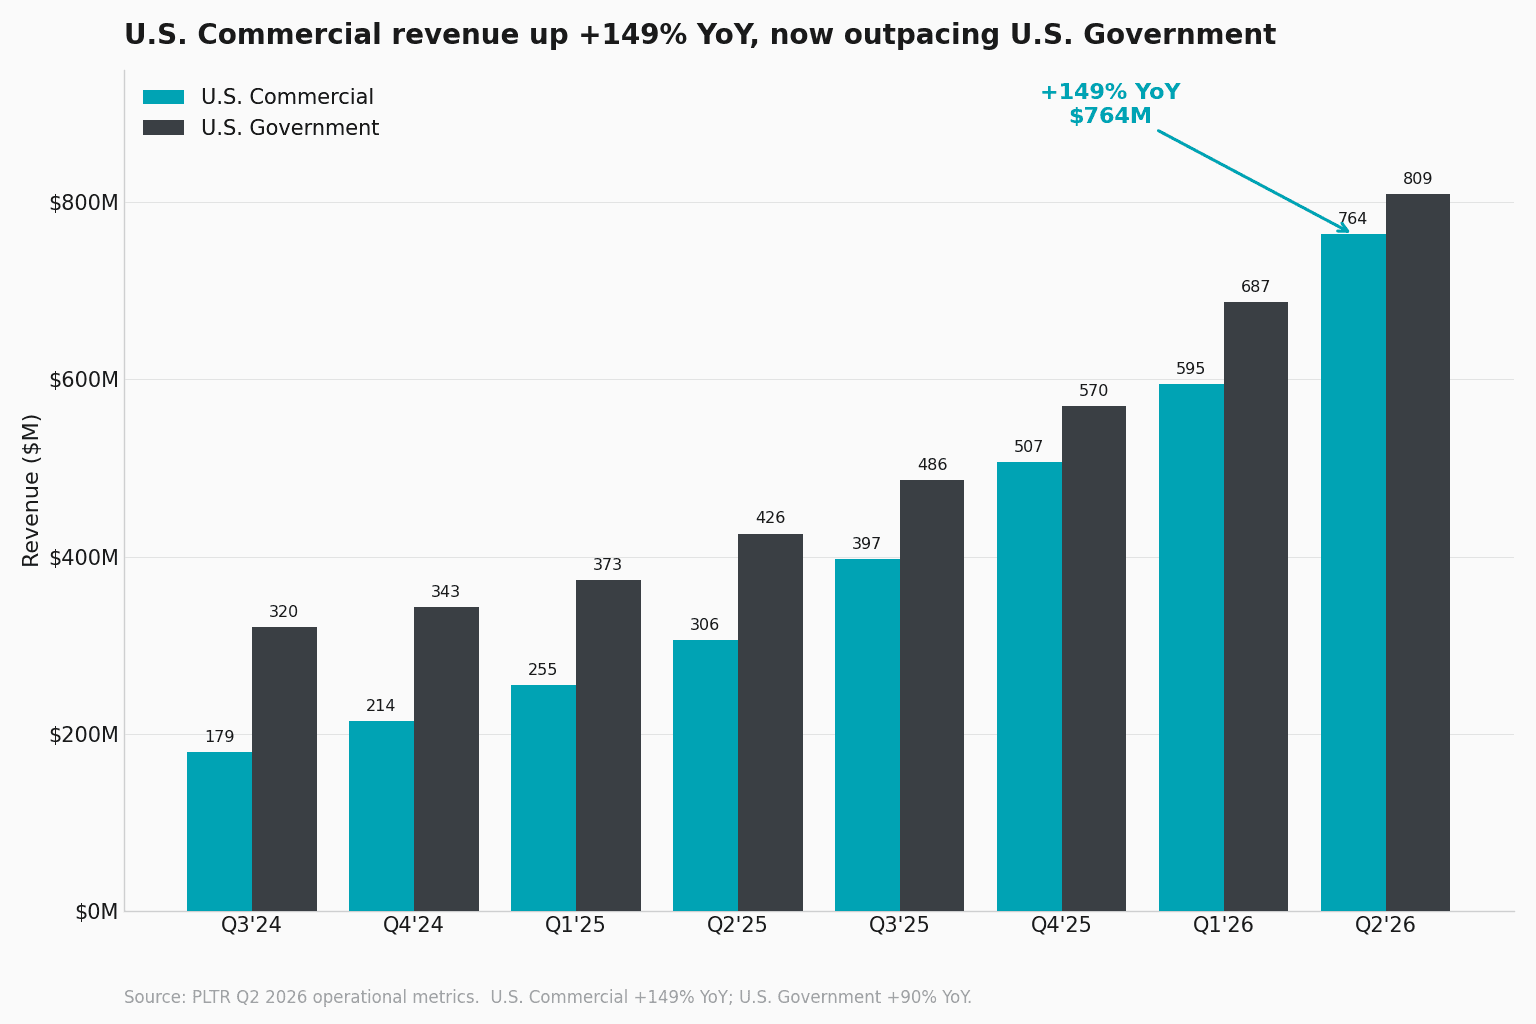
Segment split, as of Q2 2026. Government revenue was $809m and commercial revenue was $764m. The 2 halves of the business are now almost exactly the same size, which is a meaningful change from the 54% government split the company carried through FY2025.
Geographic split. United States revenue was $1.573bn, roughly 81% of the total. This company is becoming more American, not less, which cuts both ways and I come back to it in section 8.

5. Unit economics and the bootcamp flywheel
Gross margin in Q2 2026 was 84.7%, up from 82.4% for FY2025. That is software margin, not consulting margin, and the multiyear direction is up because the services intensity of new deployments keeps falling.
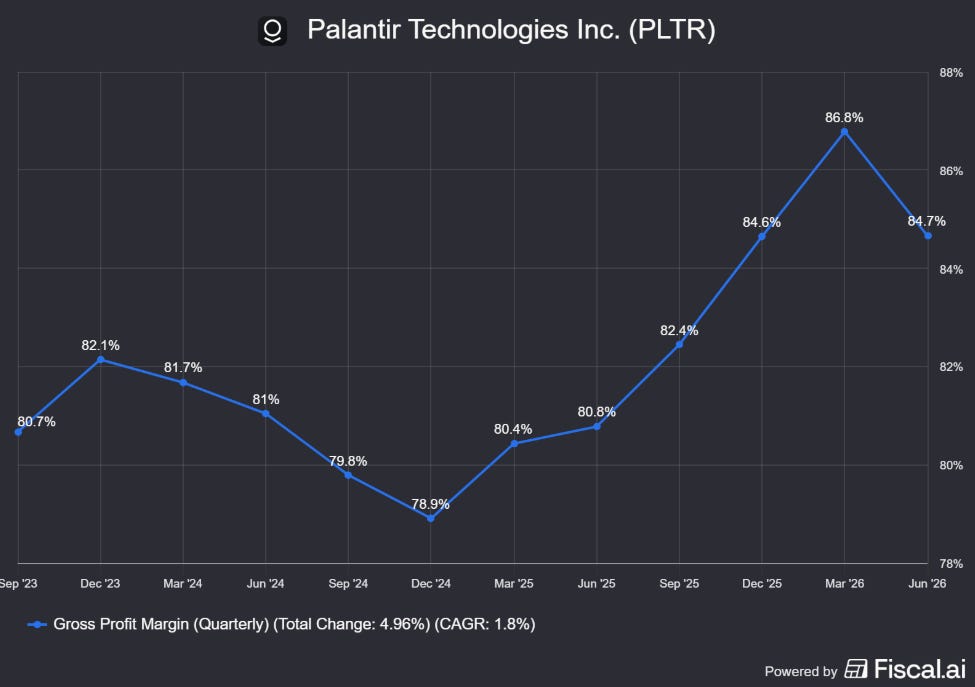
The reason it is falling is the bootcamp.
The old model required Palantir engineers to build the customer’s ontology for them over many months, which meant every dollar of new revenue carried a heavy load of human cost. The bootcamp inverts this. Palantir puts the customer’s own engineers in a room with their own data and a forward deployed engineer, and in days rather than quarters they produce something that works.
3 things happen at once. Sales cycles shorten. Deployment cost per dollar of revenue falls. And, critically, the customer builds the ontology themselves, which means the switching cost is created before the commercial terms are finalised.
That last point is worth sitting with. Independent negotiation advisers openly warn buyers about it: the pilot is cheap because the ontology work locks you in before you have agreed what the production contract costs. From a buyer’s perspective that is a trap. From a shareholder’s perspective it is a beautifully designed one.
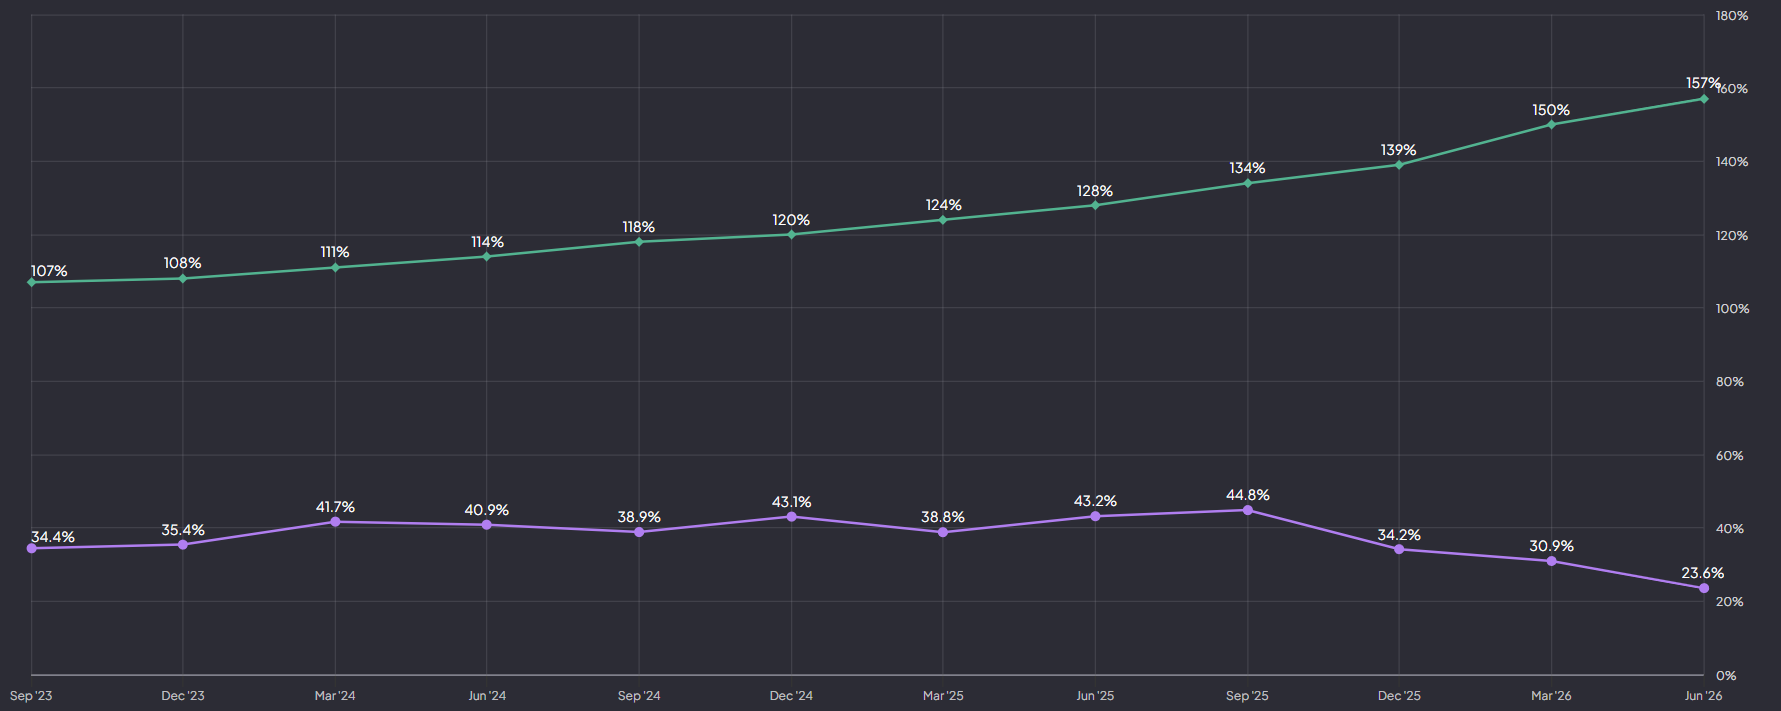
The proof is in net dollar retention. NDR reached 157% in Q2 2026, up from 150% in Q1 and from 108% at the end of 2023. That means the average existing customer now spends roughly 1.5 times what they spent a year ago, before Palantir wins a single new logo. In enterprise software, anything above 120% is considered excellent. 157% at this revenue scale is close to unprecedented.
Now look at the 2 lines in that chart, because together they explain the entire business.
Retention has climbed almost without interruption across 11 quarters, from 107% to 157%. Customer count growth has done the opposite. It peaked at 44.8% in September 2025 and has fallen every quarter since, to 23.6%.
Total customers grew 23.6%. Total revenue grew 93%.
The gap between those 2 figures is the model. Palantir is not primarily growing by finding new customers. It is growing because existing customers keep finding new things to run on the platform, and every one of them turns the consumption meter faster.
That is what a genuine platform looks like from the outside. A consulting firm has to sell every dollar again. A platform sells the first dollar and then gets out of the way.
And now the honest reading of the same chart.
A falling customer growth rate is not automatically fine, and I would rather point at it than hope you miss it.
Some of the decline is arithmetic, because each new logo counts for less against a larger base. Some of it reflects Palantir deliberately chasing fewer, larger accounts, which the deal data supports. But it also means the company leans harder each quarter on expansion inside accounts it already holds, and no retention rate rises forever. Eventually a customer has bought everything it needs.
So watch these 2 lines together rather than separately. Retention above 140% with customer growth in the 20s is a platform compounding beautifully. Retention drifting back toward 120% while customer growth keeps falling is a different business entirely. Today it is clearly the first. That is not a permanent condition.
Deal quality supports the first reading. In Q2 the company closed 220 deals worth at least $1m, of which 98 were worth at least $5m and 73 were worth at least $10m. The largest cohort is growing fastest, which is the opposite of what you see in a business running out of large customers and scraping the mid market for volume. Fewer customers, each worth far more, is a deliberate strategy rather than a failure to sell.
If the gap between 23.6% customer growth and 93% revenue growth landed for you, forward this to 1 investor who still thinks Palantir is a consulting firm.
6. Corporate governance, insiders and the compensation question
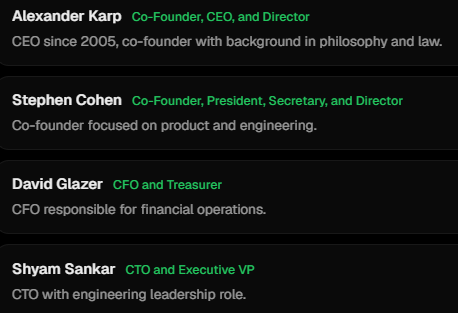
Alexander Karp, cofounder and CEO since 2005. A philosophy doctorate from Frankfurt, no engineering background, and one of the least conventional communicators in large cap technology. His public register moves between combative and messianic, which some investors find alarming and others treat as noise. What matters commercially is that he has run this company for over 20 years and has never optimised for quarterly comfort.
Stephen Cohen, cofounder and President. Focused on product and operations since the beginning.
Peter Thiel, cofounder and Chairman. Retains a significant economic and governance stake.
David Glazer, Chief Financial Officer. In the finance seat since 2013, which is a long tenure by any standard and unusually long for a company that has changed as much as this one.
Shyam Sankar, Chief Technology Officer, and Ryan Taylor, Chief Revenue Officer and Chief Legal Officer, are the 2 executives who do most of the substantive talking on earnings calls and are worth listening to directly.
The board runs to roughly 7 directors, weighted toward founders and long tenured insiders with independent members added after the direct listing. This is a founder controlled company in substance, and the governance structure reflects that. If you require conventional board independence, this is not your stock.
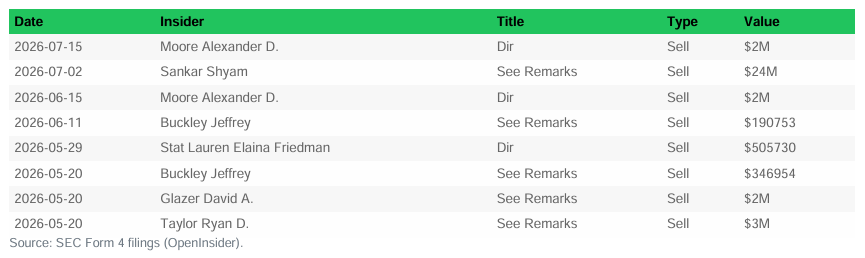
Now the part that gets used as a bear argument: insider selling.
It is real and it is consistent. Peter Thiel disposed of roughly 2m Class A shares across 7 tranches in early March 2026, priced between $140.97 and $146.80. Karp sold large blocks in February 2026 in the $132 to $135 range. Across recent quarters the net direction of insider activity has been sales, with further disposals by Glazer, Taylor, Sankar and several directors through the second quarter.
2 things are true at once here, and honest analysis requires holding both.
The bearish read is straightforward: founders who believe a stock is cheap do not consistently sell it. The bullish read is that much of this activity runs through prescheduled trading plans, that Karp and Thiel hold positions large enough that any diversification looks enormous in dollar terms, and that insider selling has been a constant since 2021 across a period in which the stock rose many times over. As a timing signal it has a poor track record here.
Our view: insider selling is not a thesis breaker, but it is not nothing either. It belongs on the monitoring list, and I come back to what would make it matter in the premium half.
Stock based compensation, in plain terms.
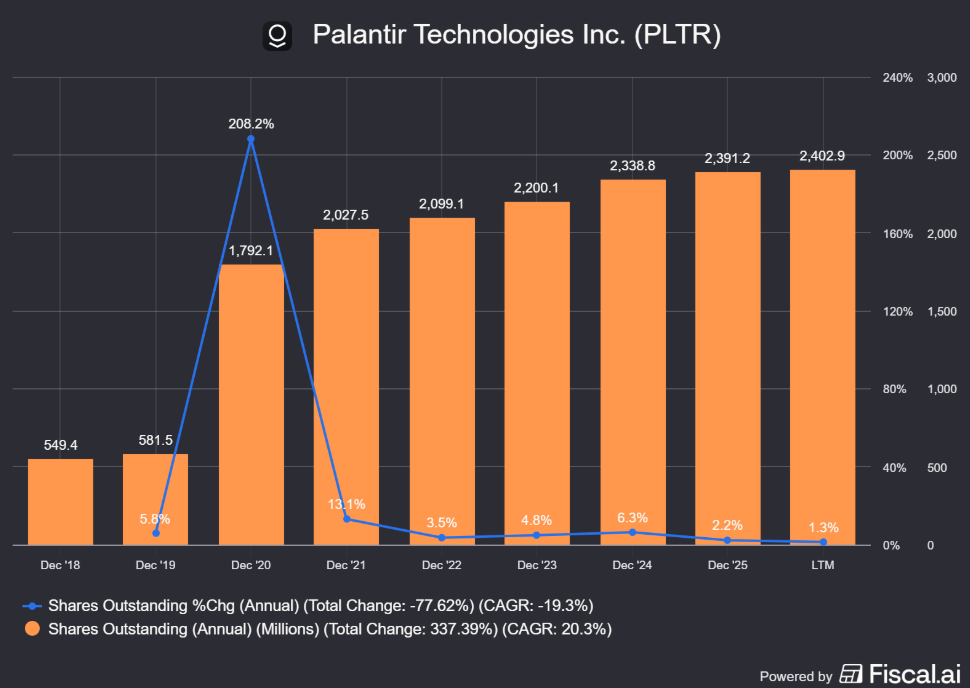
When a company pays employees in shares rather than cash, it keeps cash in the bank but issues new shares. Those new shares are claims on the same business, so each existing share owns slightly less of it. That is dilution. It is a genuine cost to you as an owner even though it never appears as a cash outflow.
Palantir’s SBC was $684m for the whole of FY2025. In Q2 2026 alone it was $265m, and $467m across the first half, against $315m in the first half of 2025. As of 30 June 2026 there was a further $916m of unrecognised expense on outstanding restricted stock units, expected to be recognised over roughly 3 years.
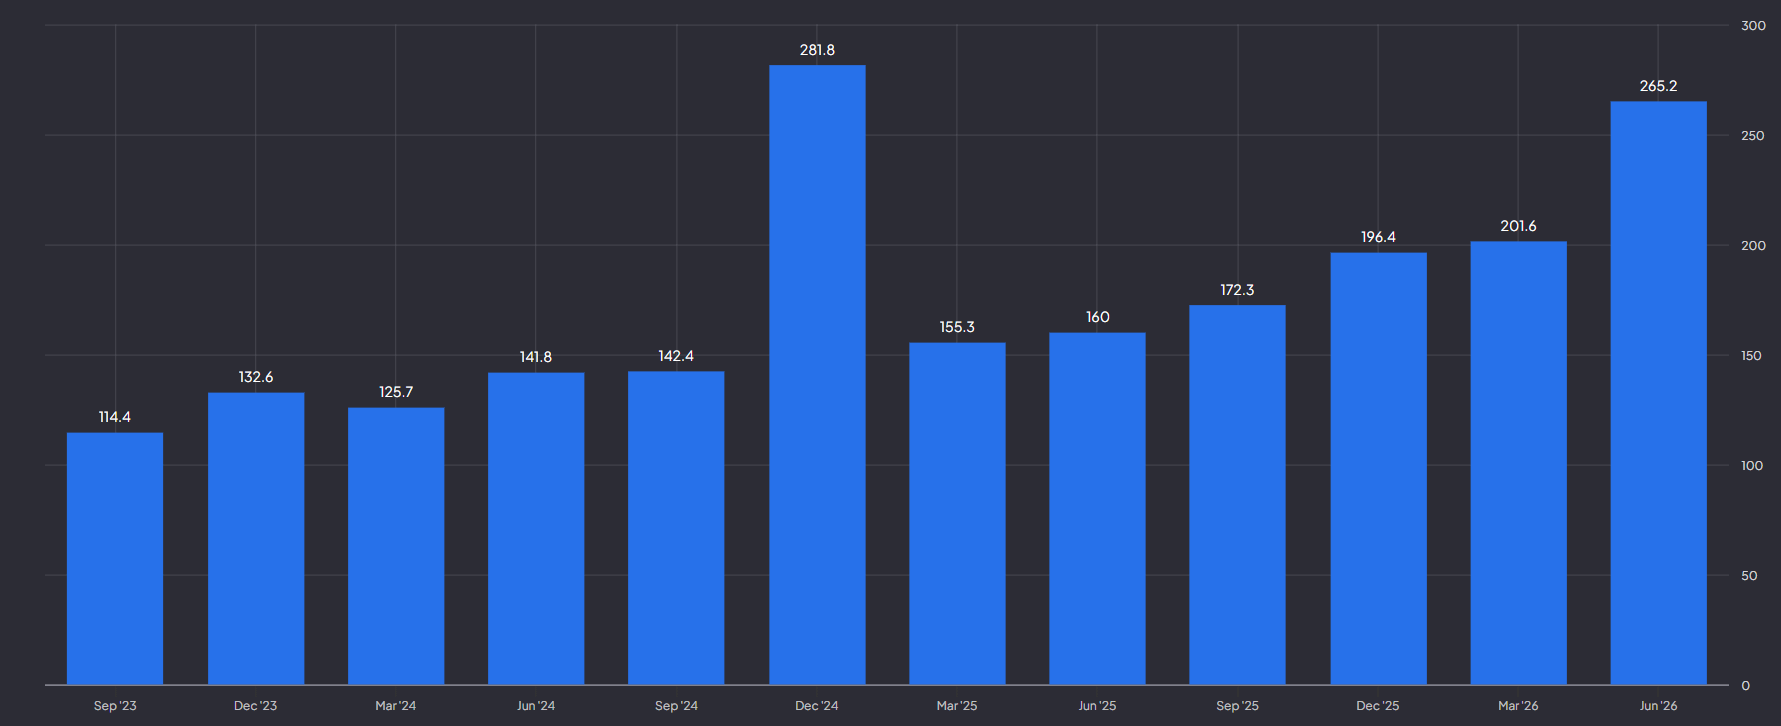
So the honest framing is this: SBC is not declining as a share of revenue in the way the bulls claimed a year ago. In absolute dollars it is accelerating. Revenue is accelerating faster, which is why the ratio still improves, but that is a different statement.
Against that, dilution is running at the lowest level in the company's public life. Shares outstanding stand at 2,402.9m, up 1.3% over the past year. The trend is the point: 13.1% in 2021 after the direct listing, then 3.5%, 4.8%, 6.3%, 2.2%, and now 1.3%.
7. Competitive advantages and how Palantir stacks up
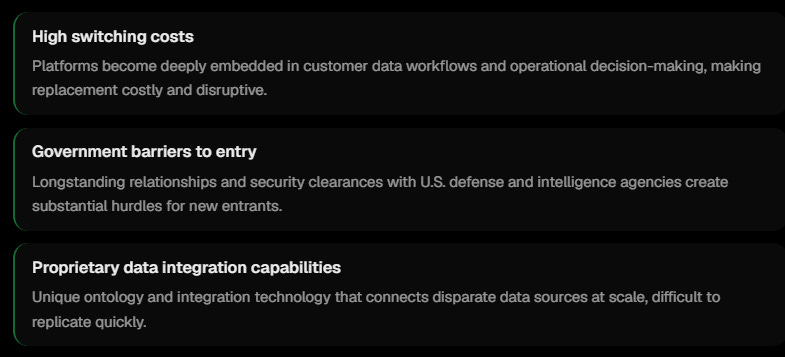
Palantir’s moat is built from 3 materials, and they are not equally strong.
Switching costs, which are severe. Once a company’s operations are modelled as objects, links and actions, and once every application, analysis and agent in the building reads from that model, leaving means rebuilding the map somewhere else. Practitioners who negotiate these contracts advise clients to secure ontology export rights and data egress terms before signing, precisely because they are almost impossible to obtain afterwards. That tells you how real the lock is.
Government barriers to entry, which are durable. Security clearances, accreditation, decades of relationships and the ability to operate on classified networks are not things a competitor acquires by writing better code. This is the most defensible part of the business and the least likely to be disrupted.
Proprietary technology, which is the weakest of the 3. The Ontology is genuinely well engineered and it has a long head start. It is not a law of physics. Every major data platform is now building toward the same semantic layer, and some of them have distribution advantages Palantir cannot match.
The peer set, ranked by how much they should worry you.
Microsoft is the highest threat, and not because its products are better. Azure AI, Fabric and Power Platform arrive bundled inside an enterprise agreement the customer has already signed. Palantir has to win on merit against something the CIO is already paying for.
Databricks is the most direct architectural competitor. Its lakehouse plus Unity Catalog approach is aimed at the same problem, it is well funded, and it is credible with engineering organisations that prefer to build rather than buy.
Snowflake competes on the analytics and data sharing side with its own semantic model, and is a genuine alternative for customers whose need stops at analysis rather than action.
The frontier labs are the wildcard. OpenAI and Anthropic are pushing into enterprise agent workflows that overlap with what AIP does. This is the substance of the big debate, and it gets a full section behind the wall.
UiPath competes on agent orchestration and process automation, at a lower level of ambition.
Now compare the numbers, using the one metric that matters most.
Net dollar retention measures whether existing customers expand their spend without the vendor selling to them again. It is the cleanest single test of whether something is a platform.
Palantir: revenue +93% y/y, net dollar retention 157%, 47% GAAP operating margin
Datadog: revenue +36% y/y, retention around 120%, profitable on an adjusted basis
Snowflake: product revenue +30%, retention 125%, negative net margin
ServiceNow: revenue +23% y/y, renewal rates near 98%, GAAP profitable
CrowdStrike: revenue +22% y/y, retention around 110%, net loss in FY2026
Read the retention numbers. The nearest comparable expansion rate in that group is 125%, and it belongs to a company growing revenue at less than a third of Palantir’s pace with negative net margins. That is the quantitative version of the argument I make behind the wall: what Palantir does that peers do not is get existing customers to multiply their spend.
Where Palantir actually wins. It wins where the customer needs to act on the output rather than look at it, where governance and auditability are not optional, and where the deployment has to work in an environment the hyperscalers cannot easily reach. It loses where the customer’s need is analytical rather than operational, where the budget is already committed to an incumbent cloud vendor, or where an engineering team would rather build the semantic layer themselves.
8. The financials: growth, margins, cash and the one segment nobody talks about
Here is where the argument gets easier, because the numbers do a lot of the work.
Growth. Q2 2026 revenue was $1.935bn, up 92.8% year over year and 18.6% sequentially. That is the fastest growth rate in the company's history. First half revenue was $3.57bn, up 89%, against FY2026 guidance of $8.15bn.
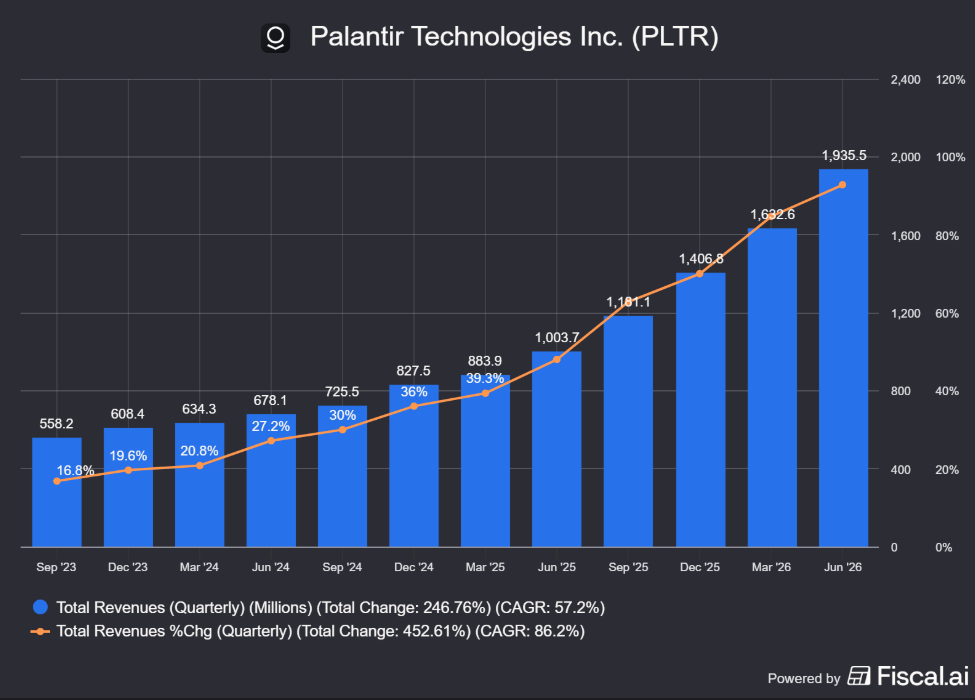
Before the segment detail, look at the orange line, because it is the most important picture in this piece.
Start at September 2023, where year over year growth had fallen to 16.8%. That was the bottom, and at the time it looked terminal. A government heavy contractor decelerating into the high teens is a company the market prices for maturity, which is exactly what it did.
Now read the line forward: 19.6%, 20.8%, 27.2%, 30%, 36%, 39.3%, 48%, 62.8%, 70%, 84.7%, 93%.
That is 11 consecutive quarters of accelerating growth, more than 5 times the rate it started at, on a revenue base that more than tripled over the same period.
Large software companies do not do this. Deceleration is close to a law of nature in enterprise software, because each year is measured against a bigger base and the easiest customers get bought first. Reaccelerating for 11 straight quarters while tripling revenue is not a normal outcome.
AIP launched in April 2023. The trough and the product are 1 and the same moment.
That is the strongest single argument that something changed in the product rather than in the marketing. It is also why a deceleration would hurt so much. You are not being asked to pay for 93% growth. You are being asked to pay for the belief that this reacceleration is structural rather than a one off AI budget cycle working its way through corporate procurement.
The composition, and read all 5 lines:
US revenue $1.573bn, +115% y/y, roughly 81% of the total
US commercial $764m, +149% y/y, +28% sequentially
US government $809m, +90% y/y, +18% sequentially
International commercial $182m, +26% y/y, +2% sequentially
International government $181m, +42% y/y, +5% sequentially
Look at that fourth line again, because it is the number the bulls skip.
International commercial revenue grew 26%. Sequentially it grew 2%. This is the same product, the same platform and the same AI cycle producing 149% growth 8,000 kilometres away, and outside the United States it is growing at roughly the pace of a mature software company.
2 readings are available and I think both are partly true.
The charitable one is that Palantir has deliberately concentrated its go to market resources where the return is highest. If your US commercial business is compounding at 149%, every engineer you send to Frankfurt is an engineer not deployed against a faster opportunity. Sales capacity is the scarce input and management is allocating it rationally.
The uncharitable one is that European enterprises are slower to adopt, more cautious on data governance, and in some cases actively uncomfortable with a vendor whose brand is built on American defence and intelligence work. If that is the binding constraint rather than resource allocation, a large part of the addressable market is structurally harder to reach than the US numbers imply.
Why this matters. It cuts both ways at once. It caps the total opportunity if the pattern persists, which is a genuine bear point. It also means the entire international business, currently 19% of revenue, is effectively unmodelled upside if Palantir ever chooses to attack it properly. I am not paying for that in my numbers, and neither should you.
Bookings and visibility. Total contract value closed in the quarter was $3.373bn, up 49% y/y. US commercial TCV alone was a record $2.132bn, up 153% y/y and 81% sequentially, which is to say that one segment’s quarterly bookings exceeded the entire company’s quarterly revenue. US commercial remaining deal value stood at $6.238bn, up 124%. Remaining performance obligations were $4.9bn.
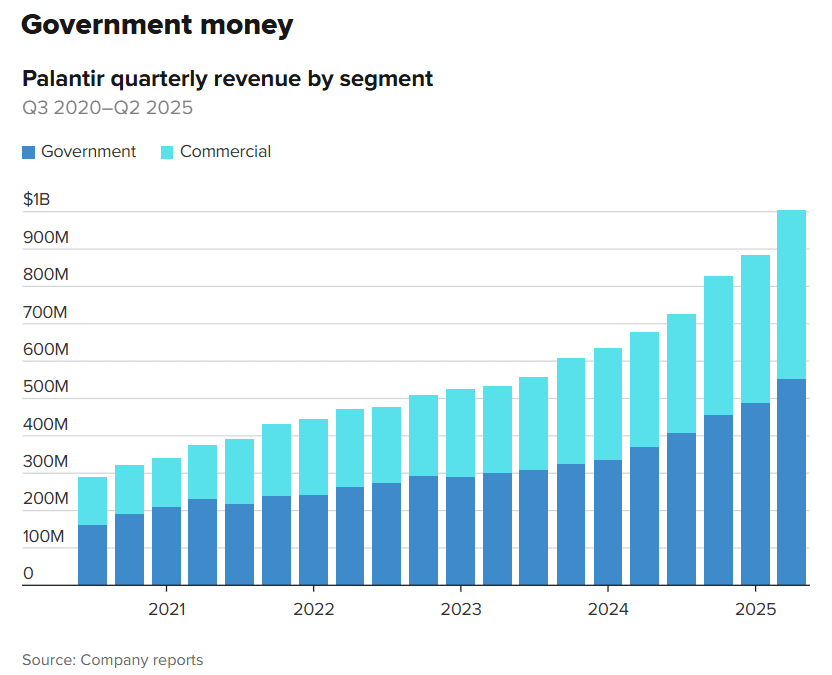
One teaching note, because this is where readers get misled. Total contract value is not backlog and it is not guaranteed revenue. It represents the potential lifetime value of agreements at signing, it can include options the customer has not exercised, and most Palantir contracts contain termination for convenience provisions. RPO is the more conservative figure and it is the one to anchor on. TCV tells you about momentum. RPO tells you about obligation.
Profitability. GAAP operating income was $912m, a 47% operating margin. GAAP net income was $1.062bn, giving diluted EPS of $0.41 against $0.13 in the same quarter last year. Adjusted operating margin reached 62%.
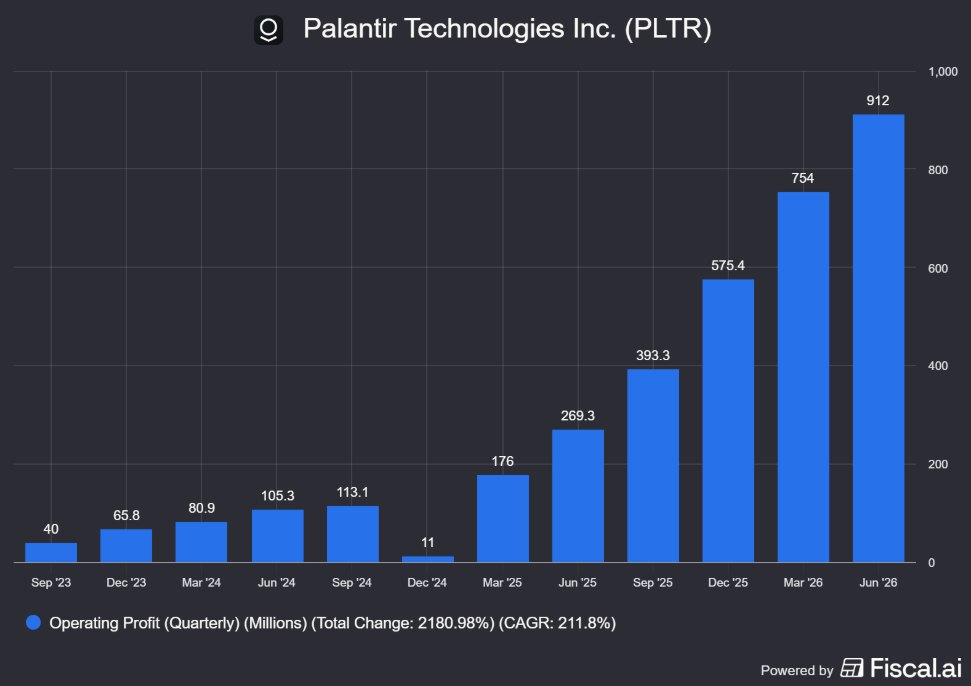
Add 93% growth to a 62% adjusted operating margin and you get a Rule of 40 score of 155%, up from 145% in Q1. For context, a score of 40 is the traditional benchmark for a healthy software company. Very good ones reach 60 or 70.
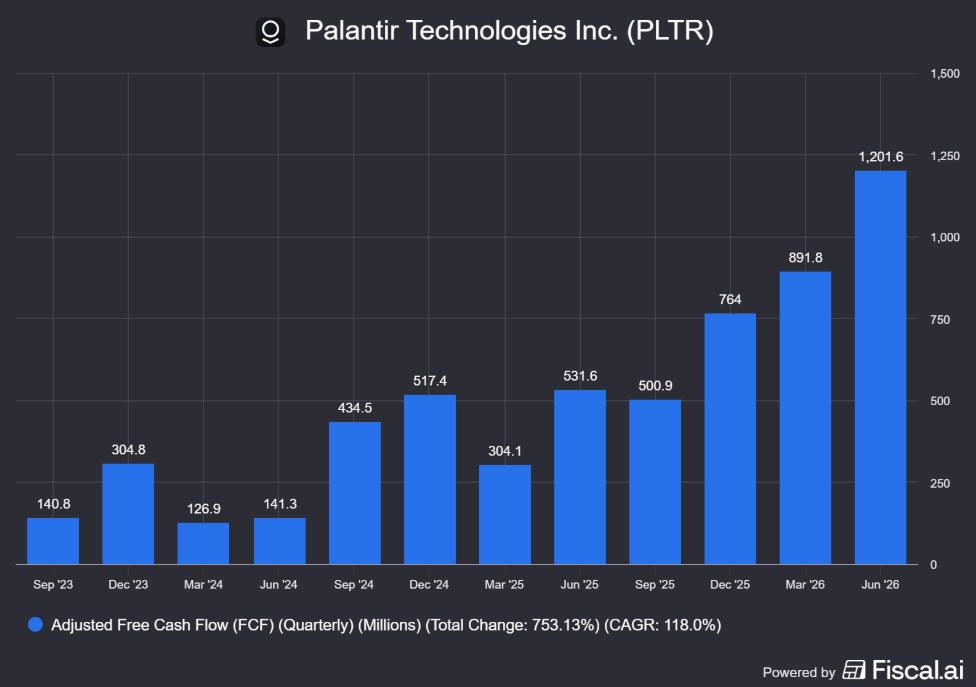
Cash generation. Adjusted free cash flow was $1.2bn in the quarter, a 63% margin. Operating cash flow for the first half reached $2.115bn.
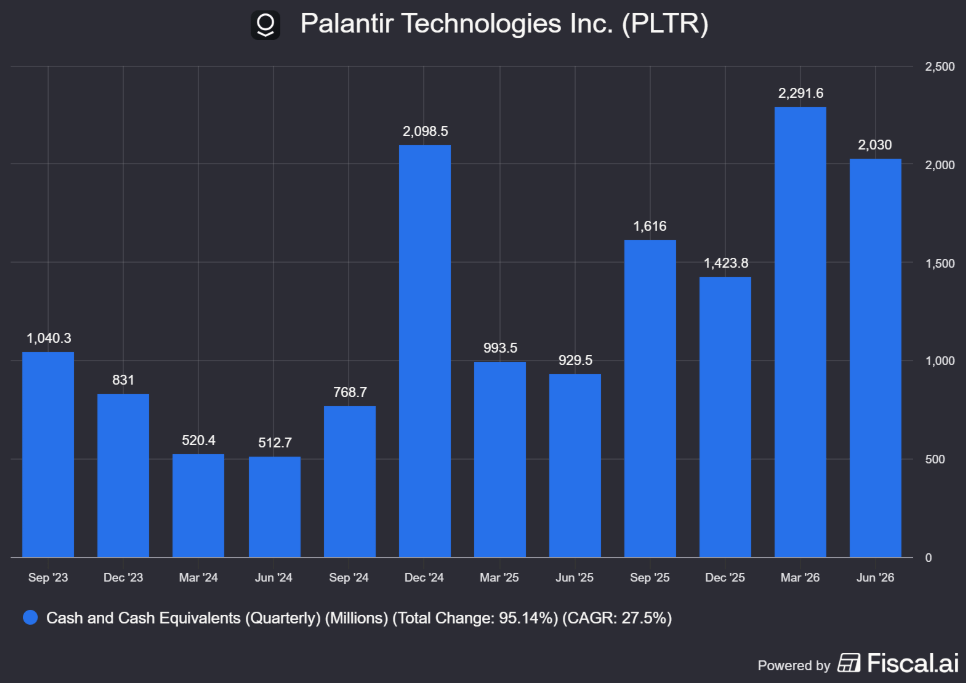
Balance sheet. Cash and equivalents of $2.03bn plus marketable securities of $7.379bn, so roughly $9.4bn of liquidity against zero drawn debt. The $500m revolving credit facility is untouched. Current ratio above 7. There is no financial risk in this business in any conventional sense.
Returns on capital, and why the headline number misleads. Return on equity reads 13.4%, which looks mediocre for a business earning 47% operating margins. Return on invested capital reads 143.3%. Same company, same quarter, a 130 point gap.
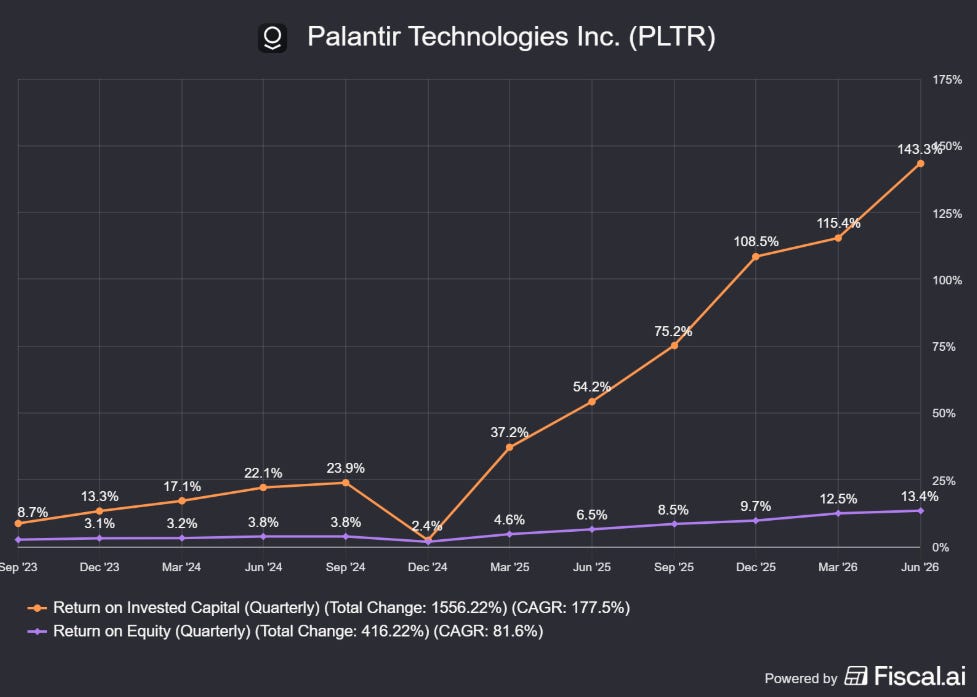
The gap is the $9.4bn of cash and securities sitting inside shareholders’ equity. That pile earns a low single digit return, and because equity is the denominator of ROE, the ratio gets dragged down by money the business is not using. ROE effectively penalises a company for being overcapitalised. ROIC strips the idle cash out and measures what the capital actually deployed in the business earns.
Both lines are climbing steeply, which is the real signal. ROE has risen from 3.1% to 13.4%, with a single dip in December 2024. ROIC has gone from 8.7% to 143.3%.
I would not lean hard on that 143.3% though. A figure that fell to 2.4% in December 2024 and reached 143.3% 18 months later is describing a fast moving denominator rather than a durable return profile, and any ROIC calculation on a company with almost no invested capital and no debt is fragile by construction.
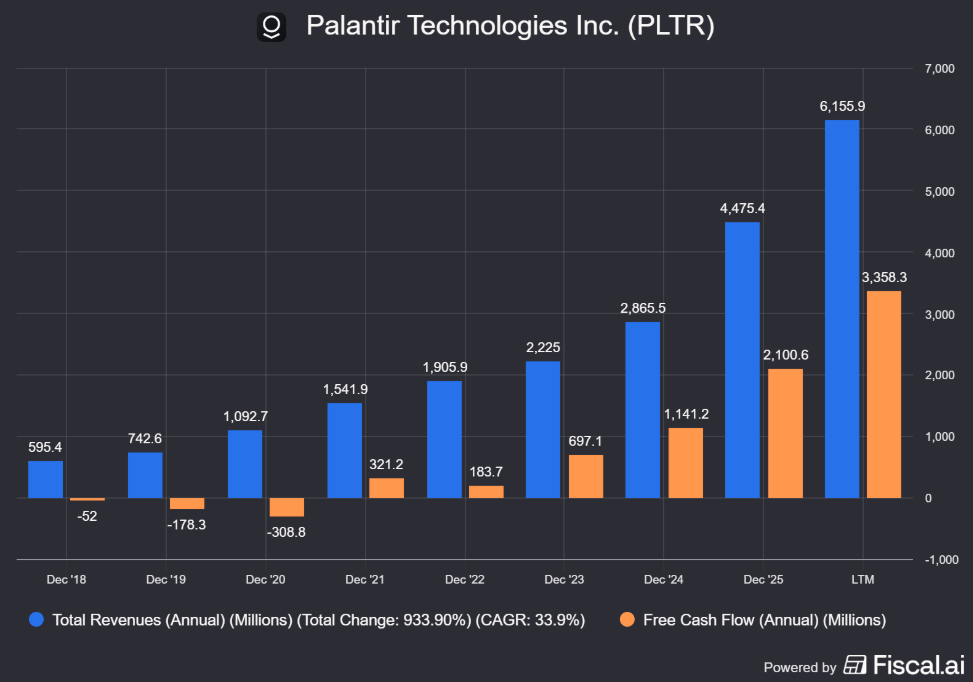
The cleaner way to see the same truth is output per head. Palantir produces roughly $6.2bn of trailing revenue from a workforce in the low thousands. That, not either ratio above, is the durable evidence of operating leverage, and it is the hardest thing on this page for a competitor to replicate.
The 5 year arc, for perspective. FY2020 revenue was $1.09bn with a $1.17bn net loss and a $309m free cash flow outflow. FY2025 revenue was $4.475bn with $1.63bn of net income and $2.10bn of free cash flow.
Guidance. FY2026 revenue is now guided to $8.150bn to $8.158bn, roughly 82% growth, with adjusted operating income of $4.889bn to $4.897bn and adjusted free cash flow of $4.5bn to $4.7bn. US commercial revenue is guided to exceed $3.424bn, at least 134% growth. For Q3 specifically, management guided revenue of $2.160bn to $2.164bn, about 83% growth at the midpoint, with adjusted operating income of $1.292bn to $1.296bn. Both sit meaningfully above where consensus had been.
One caution attached to that guidance. Management flagged a significant expense ramp in the third quarter, driven by the seasonality of new hire start dates and product investment. Expect the margin line to look worse sequentially even if revenue lands ahead of the guide. If you own this into the November print, know that going in.
Capital allocation. Essentially none, in the traditional sense. No dividend. Buybacks have been trivial relative to SBC. The company is retaining everything and reinvesting in engineering, sovereign AI capability and technical hiring. Given the returns available on incremental investment, that is the correct decision, but it does mean the cash pile keeps building without a stated purpose.
One item almost nobody has flagged. In the second quarter Palantir entered a long term cloud hosting commitment of at least $5.6bn. That is a large fixed obligation for a company whose entire investment case rests on software margins, and it is already showing up in the numbers. I take a view on it behind the wall.
Where this leaves us.
A business with 84.7% gross margins, 47% GAAP operating margins, 157% net revenue retention, 93% revenue growth approaching $8bn of scale. no debt, $9.4bn of cash, and a moat built on switching costs that its own customers’ advisers describe as a trap.
And a stock that jumped roughly 30% on the print, sits about 16% below its high, and is still marginally lower than where it started the year.
Both of those are true. Which is exactly why the interesting question is not “is this a good business?”
It is “what is it worth?”
🔒 Premium Content Ahead:
From this point on, the content is exclusive to premium subscribers.
What we’ll cover next:
Can a better AI model make the Ontology obsolete? The existential question, argued from both sides, including the head to head bake off against frontier labs that Palantir won
What stock based compensation actually costs you per share and whether the earnings you are valuing are real
Valuation and target price for FY2027, with the multiple compared against Palantir’s own history and against peers, plus a full sensitivity range showing exactly which assumption the answer depends on
The $5.6bn cloud commitment and the margin ceiling it quietly installs
5 risks that would break this thesis, each argued properly, and the specific evidence that would change my mind
Our 4 pillar thesis and the verdict: what I am doing with the position, at what price I would add, and the 3 numbers I monitor every quarter
Join the premium community to unlock the full analysis. ⬇️
