

Yield Curve Inversions and Their Impact on Stocks and Recessions

Yield curve inversions have become a key topic of discussion, with many financial experts viewing them as a warning of a potential recession and stock market drop.

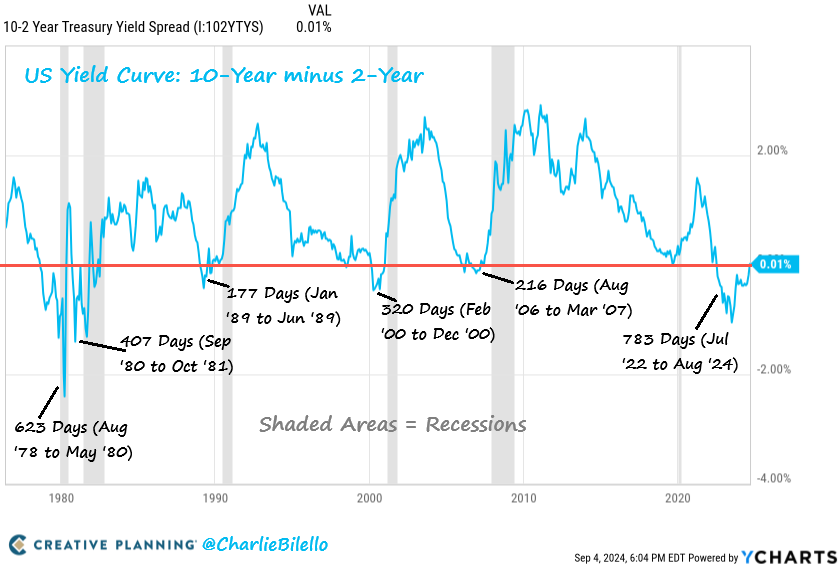
These inversions—when short-term interest rates rise higher than long-term rates—have historically been one of the most reliable signs of an upcoming recession. Recently, it took a record 20 months for the yield curve to return to normal, making this the longest delay we've seen.

While there's often a connection between yield curve inversions and recessions, the timing and impact can vary widely. Let’s explore the data and see what history tells us.
Historical Precedence of Yield Curve Inversions
Yield curve inversions have reliably preceded each of the last several recessions in the U.S., as identified by the National Bureau of Economic Research (NBER). However, the timing between an inversion and the start of a recession can vary, often leading to confusion about the indicator's reliability. Here are some key historical examples:
1980s: The early 1980s saw multiple inversions, leading to recessions in 1980 and 1981-1982. The lead time varied, but recessions generally followed within about a year after the inversion.
1990s: In late 1989, the yield curve inverted, and by 1990, a recession had begun. This pattern persisted into the early 2000s, with the 2000 inversion leading into the dot-com bubble recession in March 2001.
Late 2000s: The inversion of 2006-2007 was a precursor to the Great Recession, which began in December 2007.
2019-2020: A yield curve inversion occurred in 2019, shortly before the 2020 recession caused by the global pandemic. While the inversion preceded the recession, the situation was unique due to external factors.
These examples highlight the yield curve’s predictive power but also illustrate that the lag time between an inversion and a recession can range from several months to over a year, with an average lead time of 12 to 18 months.
Yield Curve Inversions and Stock Market Reactions
Beyond predicting recessions, yield curve inversions are often linked to stock market crashes. However, the relationship between inversions and stock market crashes isn't always clear-cut. While an inverted yield curve is typically followed by an economic recession, it does not necessarily trigger an immediate crash in stock prices.
Here are some key observations:
1970s and 1980s: Yield curve inversions in these decades led to recessions, but the stock market's reaction varied. For example, while the 1980s saw significant market volatility, periods of recovery followed shortly after.
1990s: The inversion in late 1989 led to the 1990-1991 recession, causing a market crash. However, this was not a sharp crash as seen in later recessions.
Dot-Com Bubble (2000s): The inversion in 2000 was followed by the bursting of the dot-com bubble, leading to a substantial decline in stock prices. This was a clear example of how an inversion can precede a major market correction.
Great Recession (2007-2008): The 2006-2007 inversion signaled the upcoming Great Recession, during which the stock market experienced one of its most significant declines in history.
Recent Times: The 2019 inversion was followed by an economic downturn, largely triggered by the global pandemic. While the stock market initially declined, it quickly rebounded into a V-shape recovery.
Lag Between Inversions and Market Crashes
The lag between a yield curve inversion and noticeable market reactions or economic downturns can vary widely. Historical data indicates an average lag of 12 to 22 months from the inversion to the start of a recession. During this time, the stock market might continue to rally or show resilience, often peaking within 6 to 18 months before a downturn begins. However, this is not a strict rule, and variations in timing have been observed across different economic cycles.
Exceptions and False Signals
It's important to note that not every yield curve inversion leads directly to a recession or a stock market crash. Some inversions are false signals, where the economy avoids a downturn despite the inversion. For example, in the mid-1960s and parts of the 1990s, the yield curve briefly inverted without causing a recession or significant market downturn.
Key Takeaways for Investors
Yield Curve Inversions Are Strong Indicators, But Not Guarantees: While an inverted yield curve has preceded many recessions, it does not always lead to an immediate stock market crash.
Timing Is Uncertain: The lag between inversion and recession or market declines can range from several months to over a year. Trying to time the market based solely on the yield curve can be challenging.
Stay Focused on Long-Term Trends: Rather than reacting to short-term signals like yield curve inversions, it's often wiser to stay focused on long-term market trends and maintain a disciplined investment approach.
While it has historically been a reliable recession signal, markets remain unpredictable. Despite the intense focus from analysts, the media, and social media, no one can predict with certainty how the economy and stock market will react. This uncertainty has led many investors to miss out on significant stock market gains after the bear market ended in 2022, as the fear of a recession caused them to stay on the sidelines.
Thank you for reading. If you're enjoying the insights, hit the button below to unlock all my exclusive content.
Written by Timothy Assi, a popular investor on eToro.
Connect with me on:
🟦 Linkedin: Timothy Assi
🟪 Instagram: @panic_drop
⬛ X: @timoassi