

Why Bitcoin's Most Bullish Environment Ever Produced a Red Year
Bitcoin Roadmap

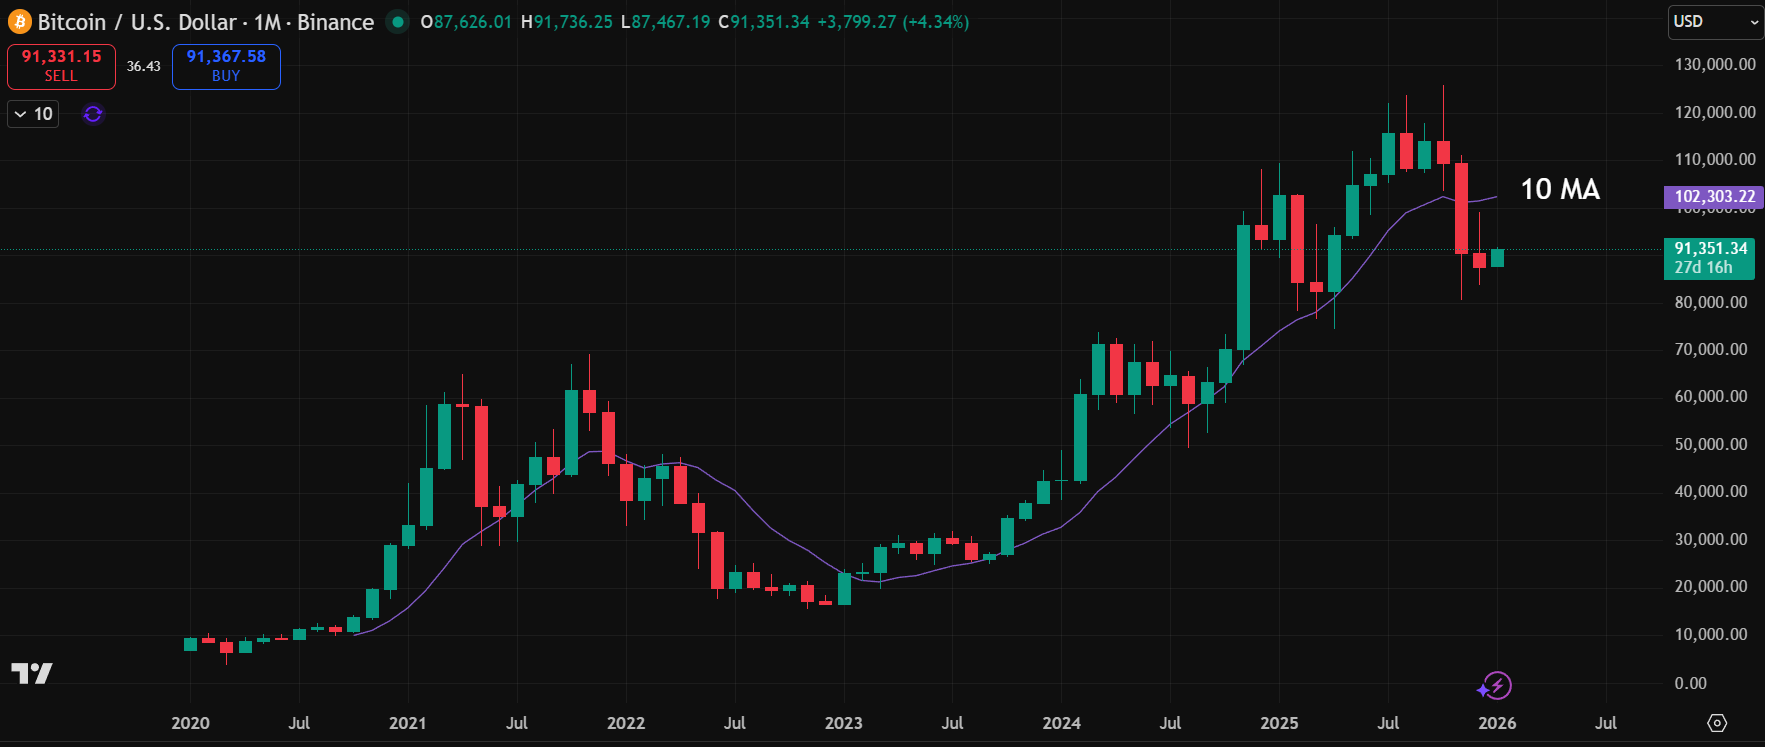
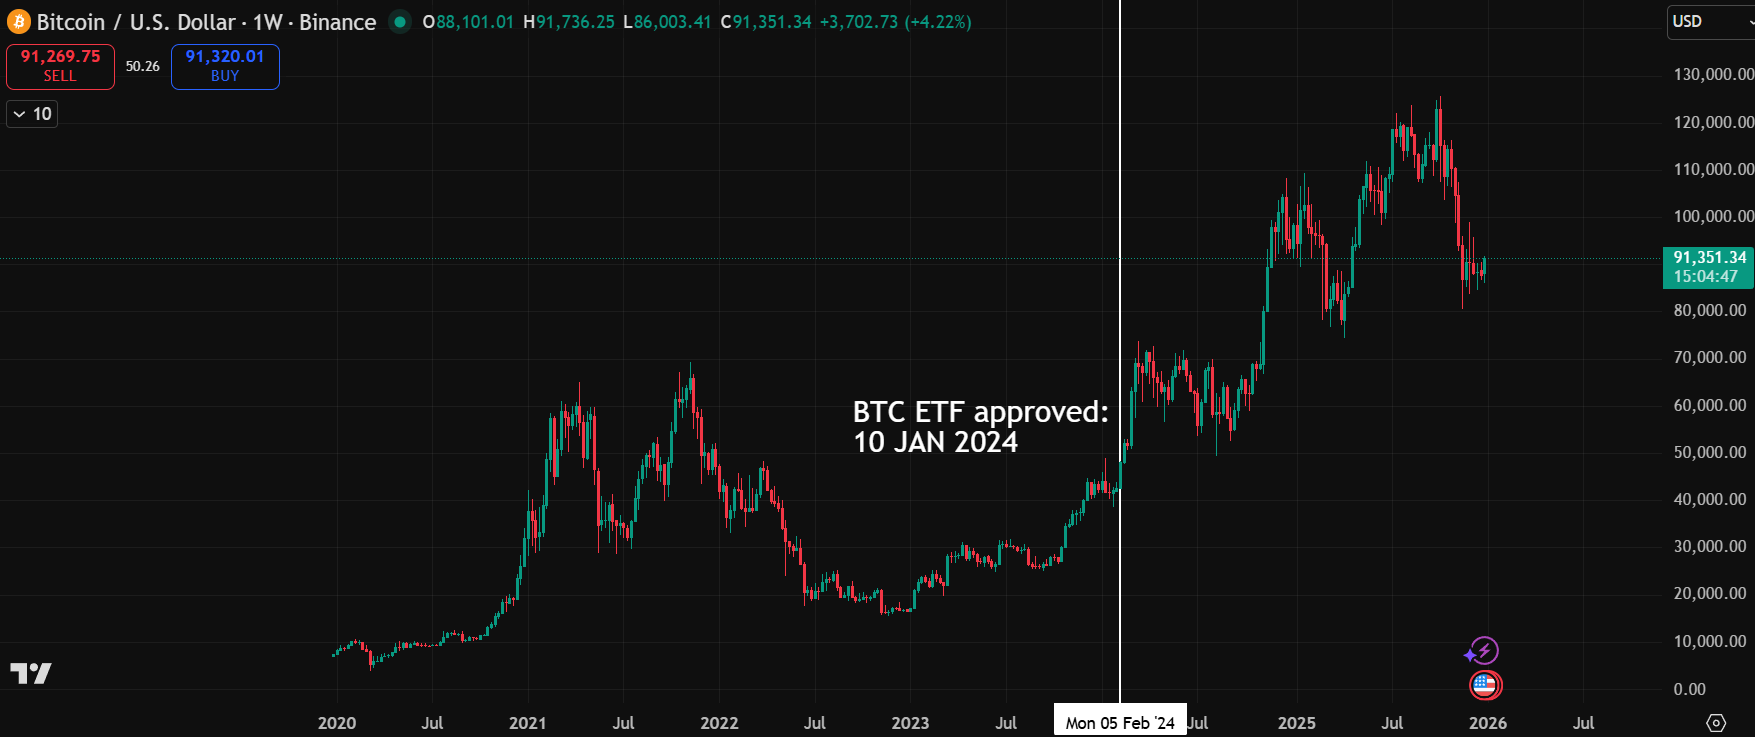
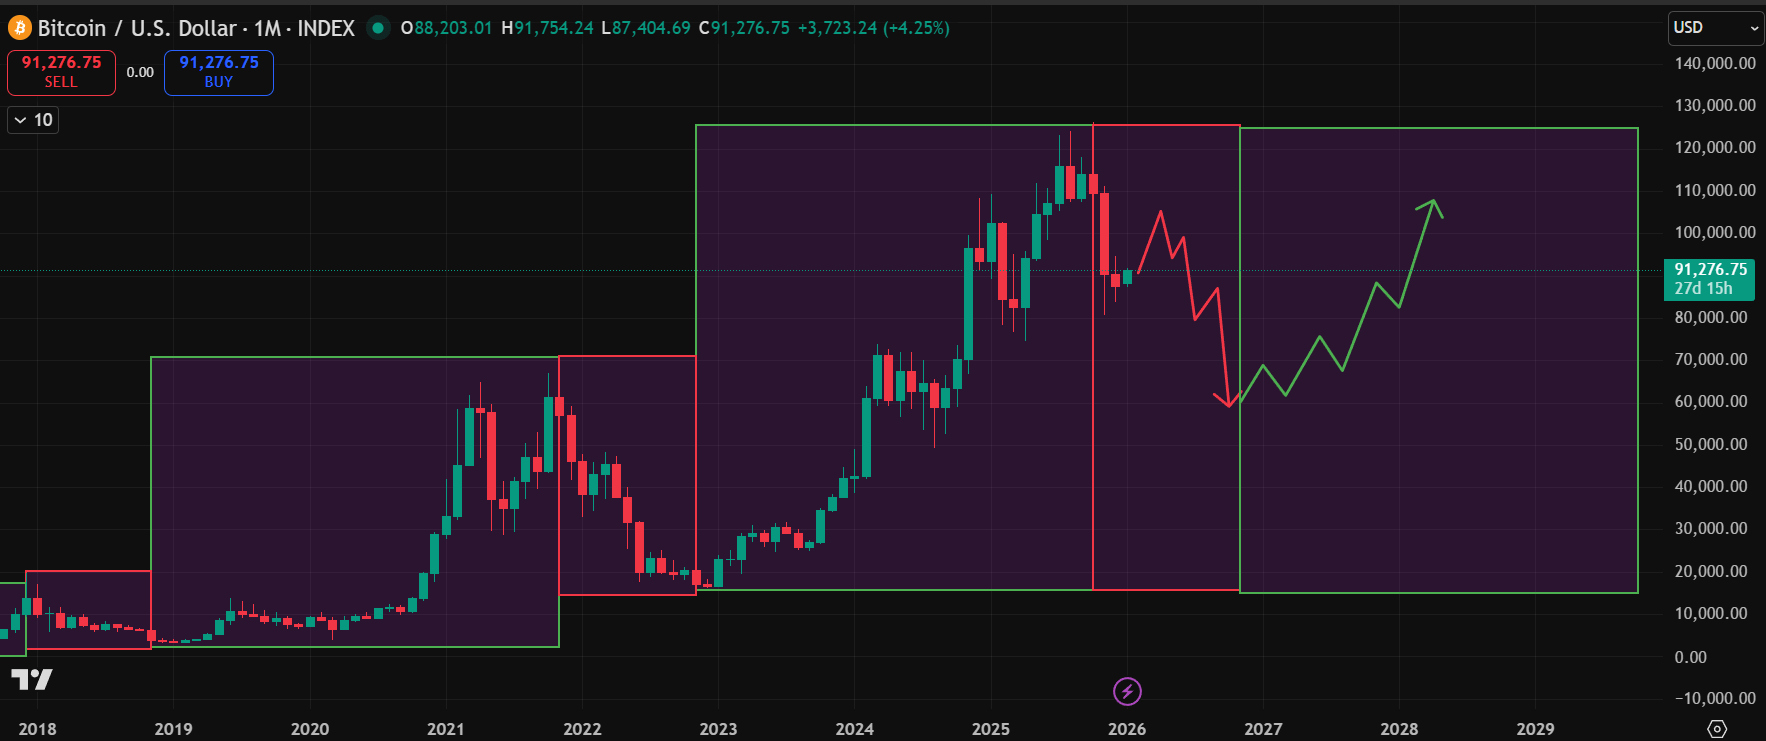
Bitcoin climbs back above $91,000 following weeks of weakness, yet the monthly timeframe reveals why this bounce might not be what it seems.
Bitcoin made an all-time high and then breached the 10-month moving average, closing firmly below it. That December candle didn’t just fail to move higher; it showed us that demand simply isn’t there despite all the positive narratives.
Now compare that to the S&P 500. The contrast is striking. Traditional markets recovered strongly in December and pushed back to all-time highs. The 10-month moving average sits well below current prices. These are correlated risk assets, yet they’re telling completely different stories.
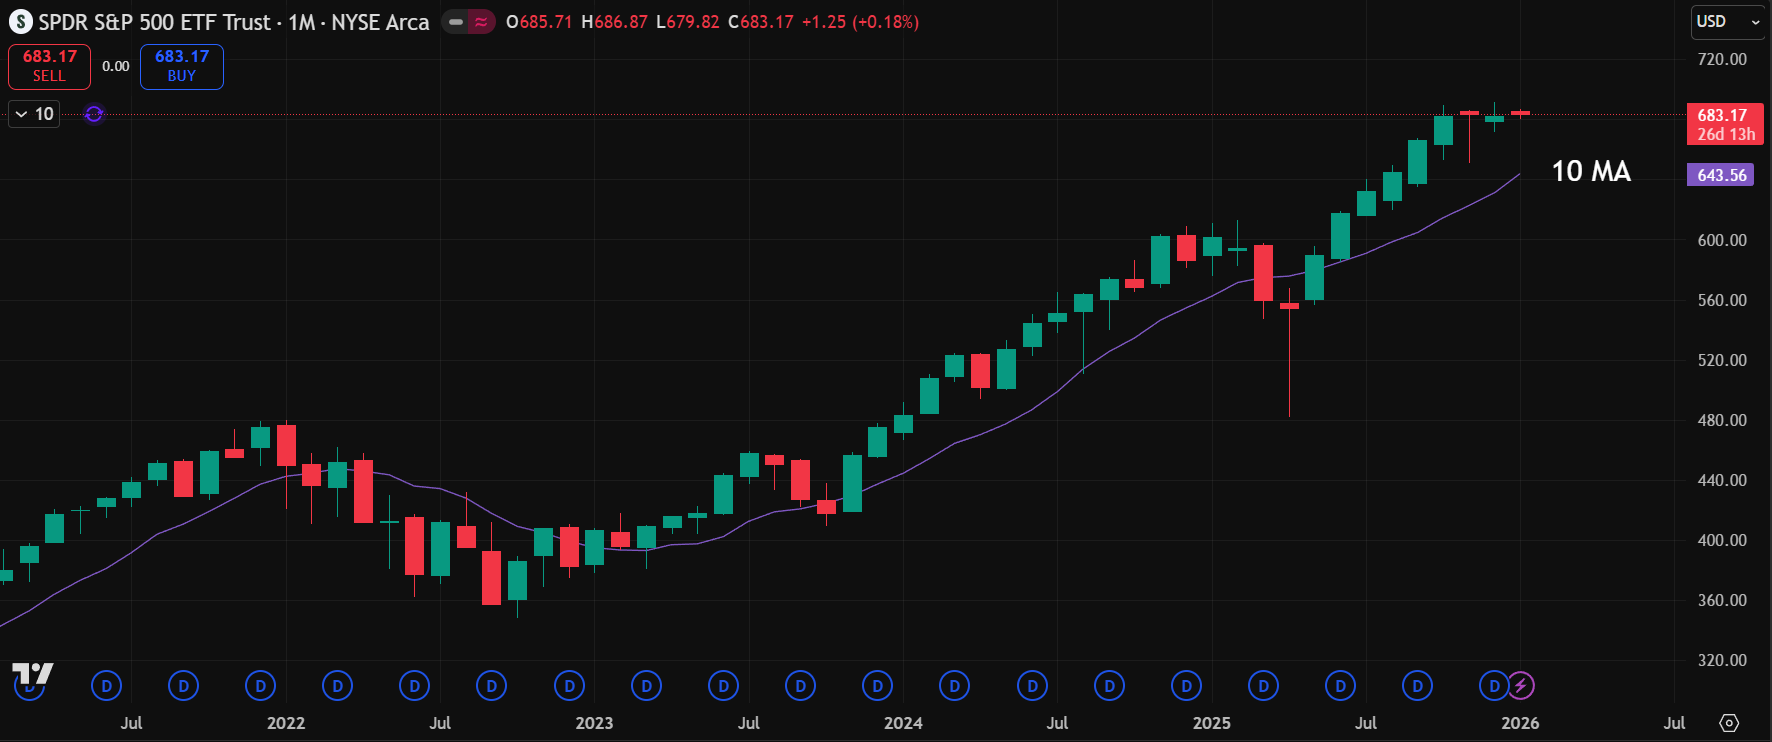
You can’t ignore this kind of divergence and assume it will suddenly reverse without good reason. The market is clearly saying something, and I think we need to listen.
Why This Cycle Feels Different
Here’s what I’ve been wrestling with: that peak occurred on month 35 of the four-year cycle. The last cycle peaked on month 35. The cycle before that also peaked on month 35. We’ve lost the 10-month moving average. There has been technical damage just like in similar periods from previous cycles.
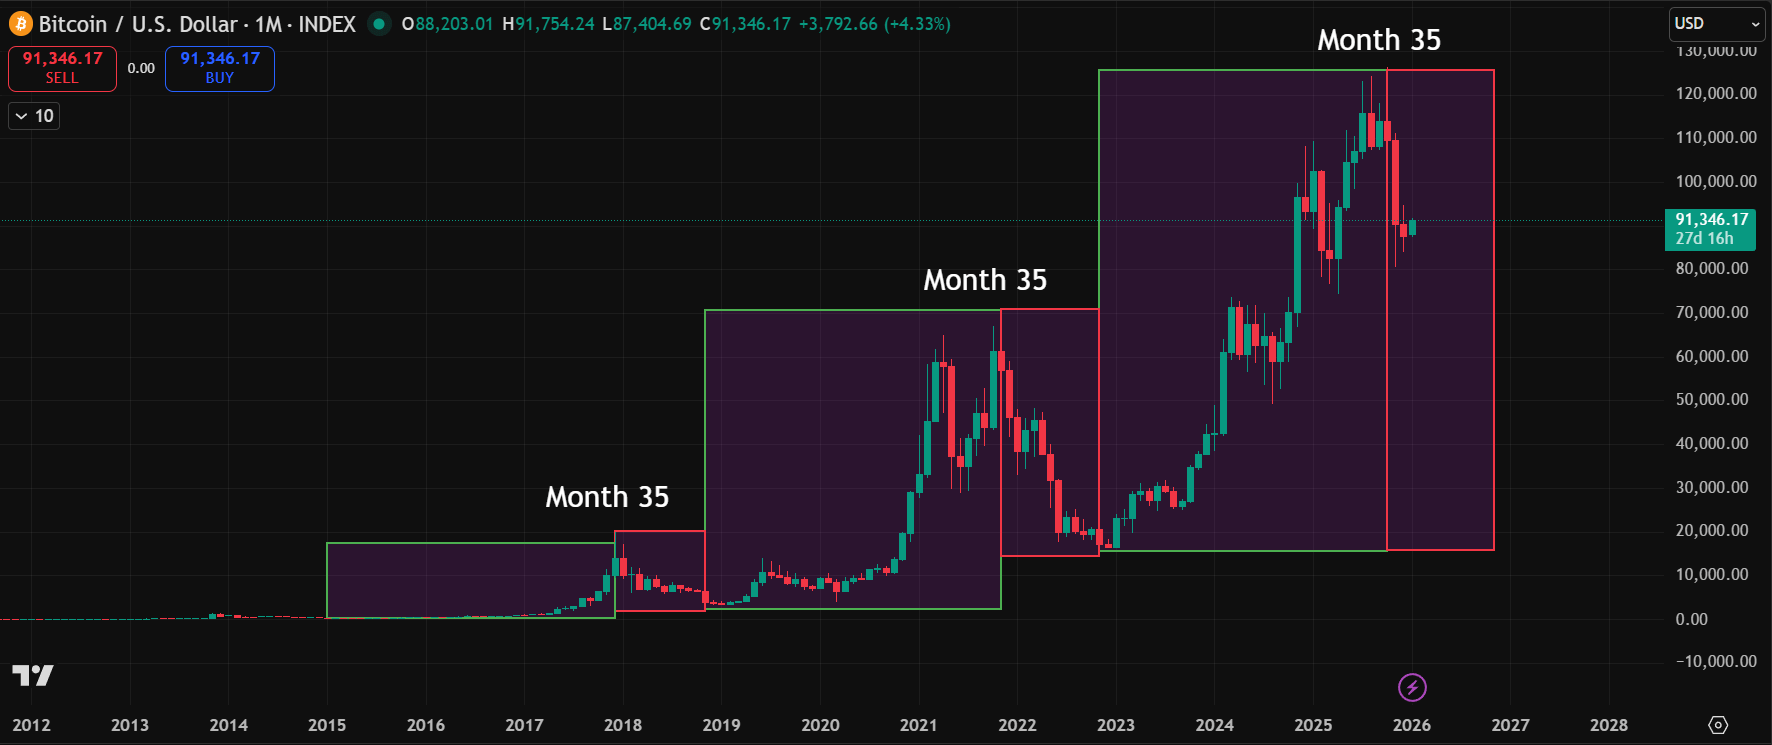
My conclusion is straightforward: the four-year cycle has peaked.
Can I be wrong? Absolutely. I listened to bullish analysts and tried to understand their perspective. I really wanted to find a compelling counterargument.
The bullish cases generally fall into two categories, and neither one holds up under scrutiny.
1. The Liquidity Argument Doesn’t Add Up
The first argument says Bitcoin is weak because we’re waiting for the business cycle to turn and liquidity to return. But here’s my problem with that: why are equities pushing all-time highs after a three-year run if they’re facing the same liquidity pressures?
If Bitcoin and stocks are correlated assets that both depend on the business cycle and liquidity conditions, they should both be under pressure. Yet stocks are thriving while Bitcoin struggles. The market is clearly making a choice, and that choice is to avoid Bitcoin risk right now.
2. The Red Candle Isn’t Breaking the Cycle
The second argument points to the third yearly candle being red, something that hasn’t happened in previous cycles. People say this means the four-year cycle is broken or fundamentally changed.
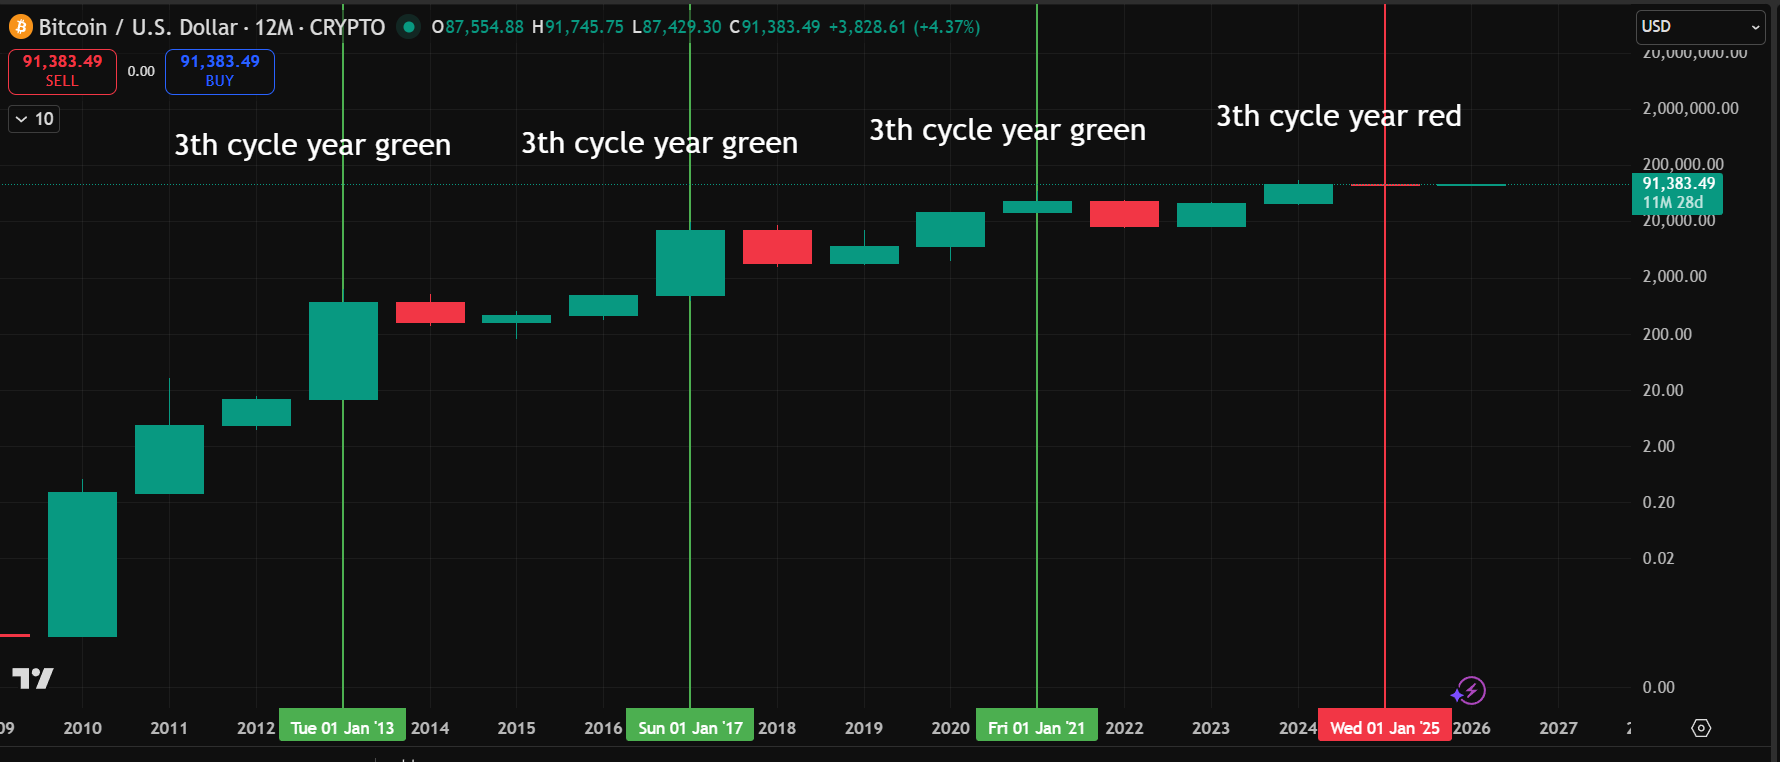
I think that’s backwards logic. Here’s what I believe actually happened:
We’ve had the most bullish environment for Bitcoin since its creation:
No hate from regulators.
A pro-Bitcoin administration.
ETF approval. Companies adding Bitcoin to their balance sheets.
This should have produced a massive blowoff top that made 2017 look small.
Instead, we got a red yearly candle. That’s the real question we should be asking: why wasn’t there a euphoric climax given all these tailwinds?
The Perfect Liquidity Event
I think what fooled a lot of people is that this was an excellent liquidity event for early holders and institutions. Think about it from their perspective. Many funds and institutions positioned themselves early, getting in around 50,000 to 55,000. Within 12 months, they’re up 100%. That’s the kind of performance funds dream about.
These institutions aren’t Bitcoin ideologists. They don’t think about changing the world. They see opportunities for profit, and they take them. A 100% gain in a year is extraordinary by any measure, so they rotated out.
The ETF approval, the Trump administration’s crypto stance, the regulatory clarity, all of it enabled sophisticated players to enter, capture massive gains, and exit. What looks like bullish infrastructure to retail investors was actually an exit ramp for whales.
What Happens from Here
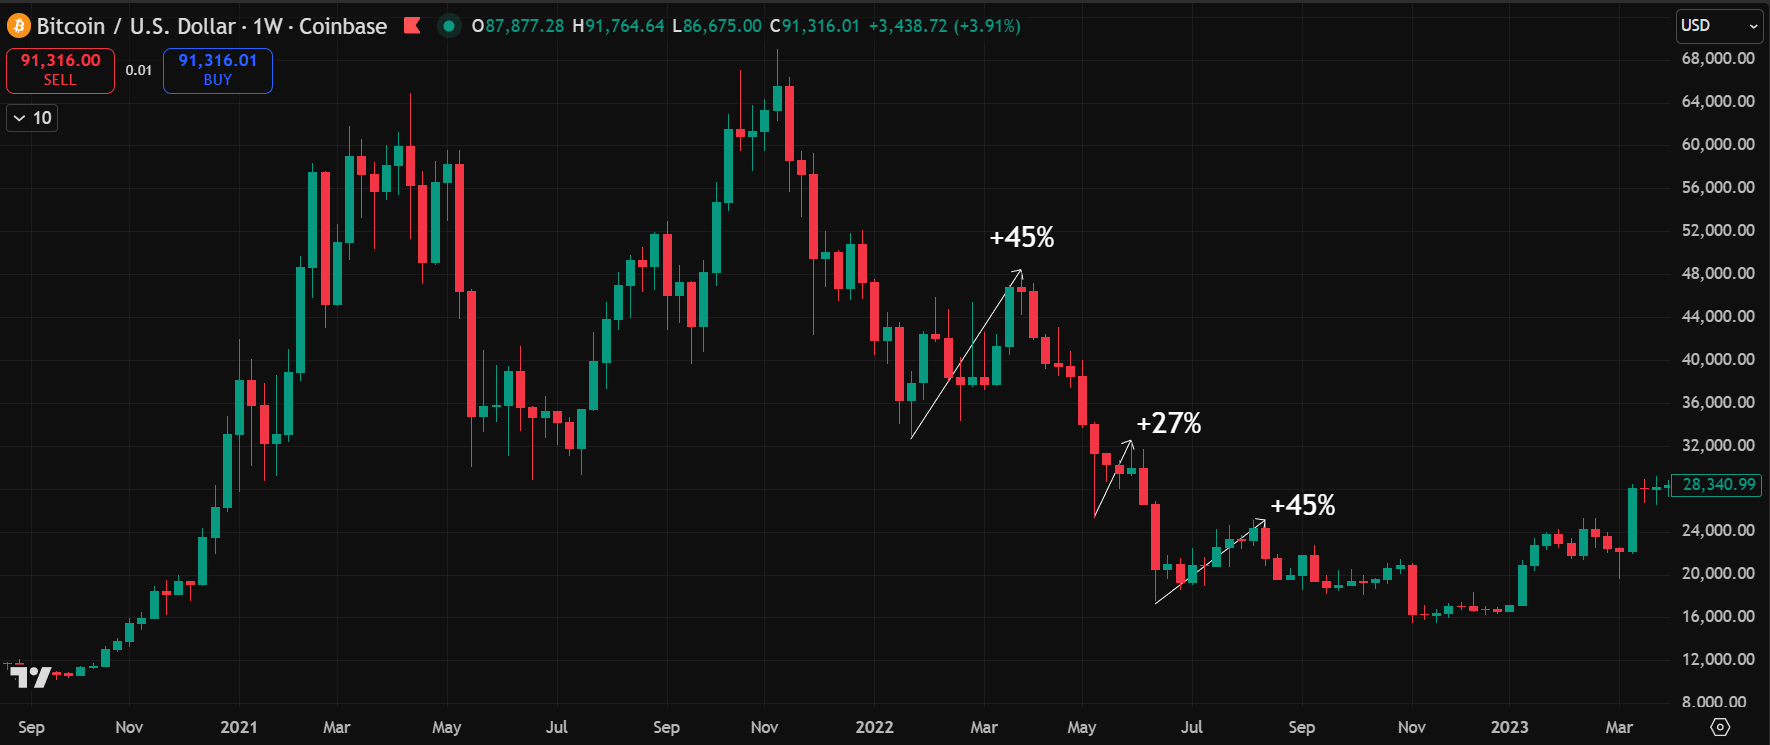
Even in a declining four-year cycle, you get significant countertrend moves. Looking at previous bear markets, we’ve seen rallies of 30% to 45% or more during the declining phase. These aren’t small moves. They’re real opportunities.
The question right now is whether we get that countertrend rally from current levels or from much lower prices. Can Bitcoin hold this range and push back toward 107,000, filling that gap and giving everyone one more chance to exit? Or does it break down here, capitulate into the 60,000s, and then produce a monster rally from deeply oversold levels?
Nobody knows which way this resolves. The market is indecisive, and it can go either way.
This is exactly the kind of environment where patience pays off. Rather than forcing trades in the middle of this range, I prefer to wait for confirmation and manage risk carefully. Getting chopped around in tight ranges is one of the easiest ways to damage your position.
My approach right now is simple: let the market show its hand first.
If Bitcoin reclaims the $94,000 to $95,000 level with conviction, that’s my signal to add exposure. That move would suggest the countertrend rally is starting from here, and I’d target the 100,000 area where a lot of resistance lies.
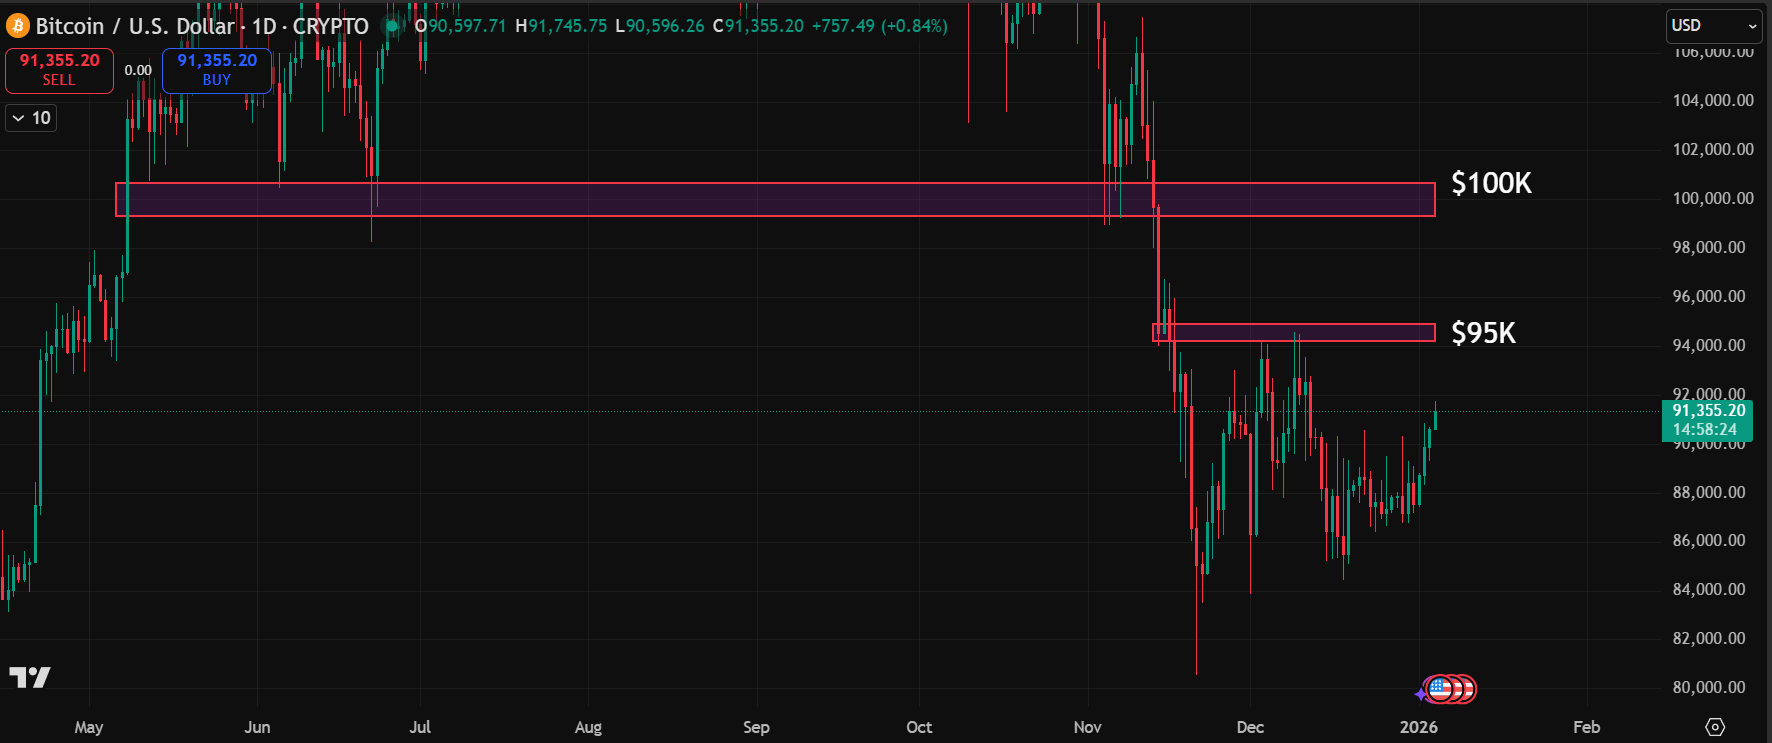
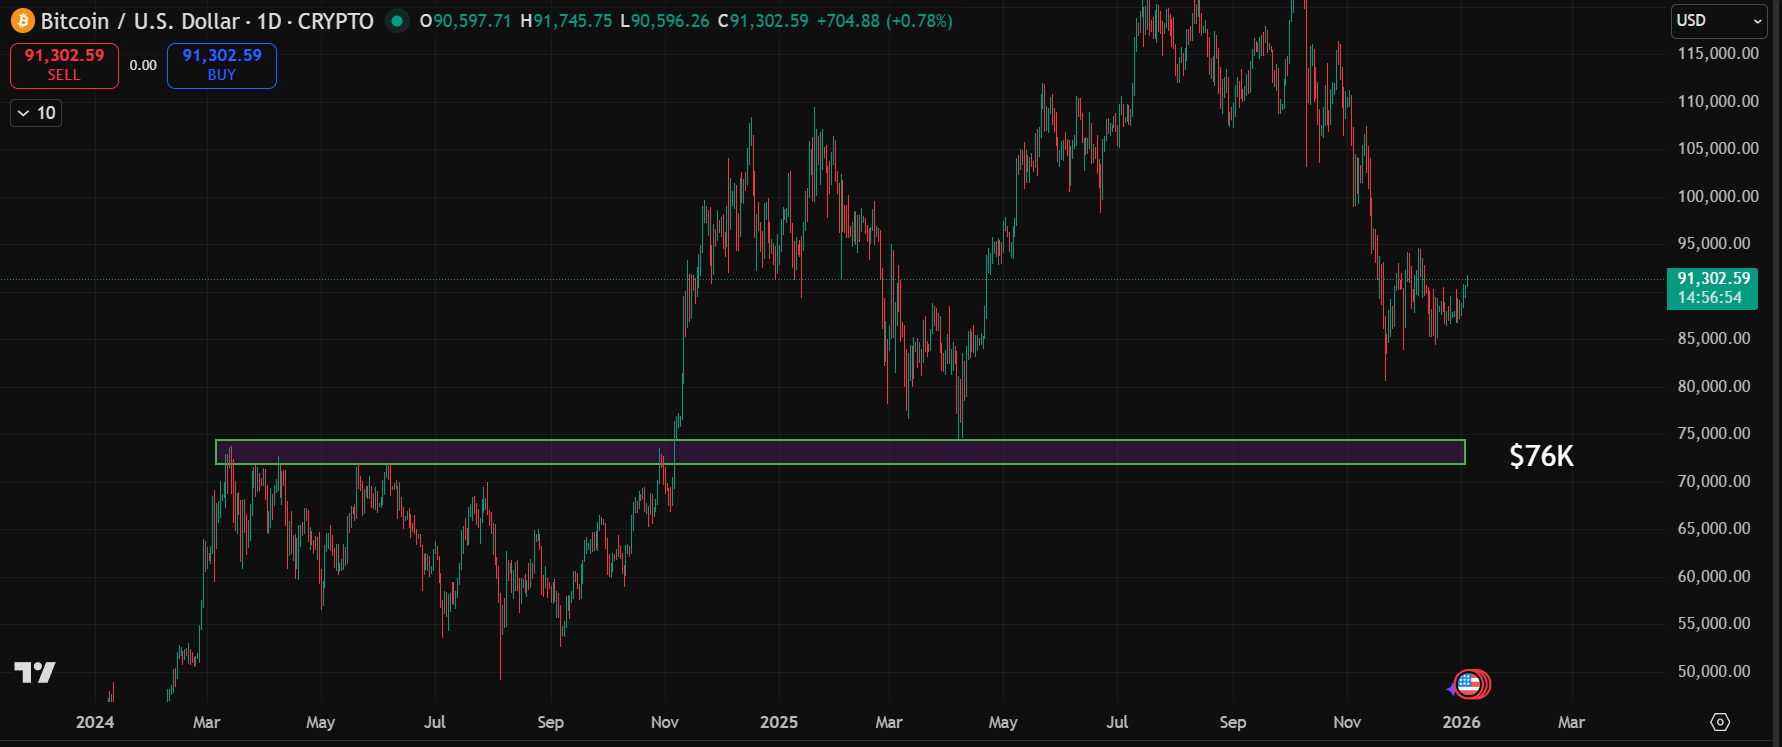
On the flip side, if we break down from here, I’m watching $76,000 as a level with strong support. A decline to that area would likely produce extreme bearish sentiment and set up conditions for a significant bounce. That’s where I’d look to enter long positions again, but with clear resistance levels in mind for exits.
Managing Position and Expectations
From a strategy perspective, I believe the four-year cycle has peaked. My long-term positioning reflects that view with significant sales already made.
But crucially, I maintain a core holding that ignores these cycles entirely. That’s my insurance against being completely wrong about this analysis. If Bitcoin does something entirely different and we see true hyperbitcoinization with a move to 300,000 or 400,000, a solid core position ensures participation in that scenario.
I think that outcome is unlikely based on what I’m seeing, but markets can throw curveballs. You don’t need massive exposure to benefit from a truly transformational move if it happens.
If Bitcoin continues to break down, it doesn’t mean Bitcoin is finished. Far from it. It means we’re likely entering the declining phase of the four-year cycle, which will eventually set up the next four year cycle.
Thanks for reading!
PS… Want the complete shortcut to trading altcoins with precision (without wasting months on trial-and-error)?
Click here to grab the Altcoin Profit Toolkit — 8 structured modules + 3 indicators including the Smart Exit Decoder that shows overbought conditions on multiple timeframes, helping you scan, enter, and exit trades like a pro trader.
Written by Timothy Assi, an Elite Popular Investor on eToro.
Not investment advice. eToro is a multi-asset investment platform. Your capital is at risk. For information and educational purposes only.
Copy Trading does not amount to investment advice. The value of your investments may go up or down. Your capital is at risk.
Connect with me on:
🟦 Linkedin: Timothy Assi
🟪 Instagram: @panic_drop
⬛ X: @timoassi
📧 timothy@panicdrop.com
🟩 Panic Drop Podcast : on your favorite streaming app
Repo market (liquidity stress) towards the end of the year and a weak real economy are the reasons Bitcoin had a poor risk-adjusted 2025.
Stocks are driven by profit margins and consumption from the top 50% of the economy are mostly what matters in this bifurcated economy.