


Wednesday brought a heavy flush across tech, AI and semiconductors. Semis have given back close to 30% from their highs, and every single one of them was trading below its 50 day exponentional moving average.
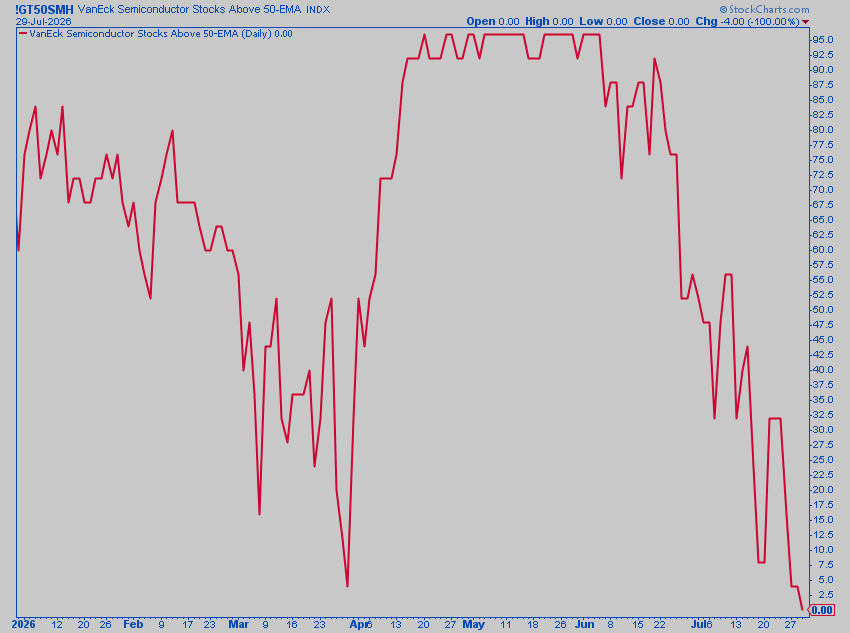
The percentage of semiconductor stocks above the 50 EMA printed zero. The percentage above the 20 EMA printed zero as well. When those two readings collapse to the same number at the bottom of the scale, the selling was indiscriminate. Pair that with the heaviest volume in years and you get the profile of a flush.
That is where I added exposure. I bought back into the semiconductor sector and took individual positions in NVDA and AVGO. Absent a recession and a broad earnings downturn, upside risk from here looks greater than downside risk to me.
We also saw financials print another all time high this week. Transports were at all time highs days before that.
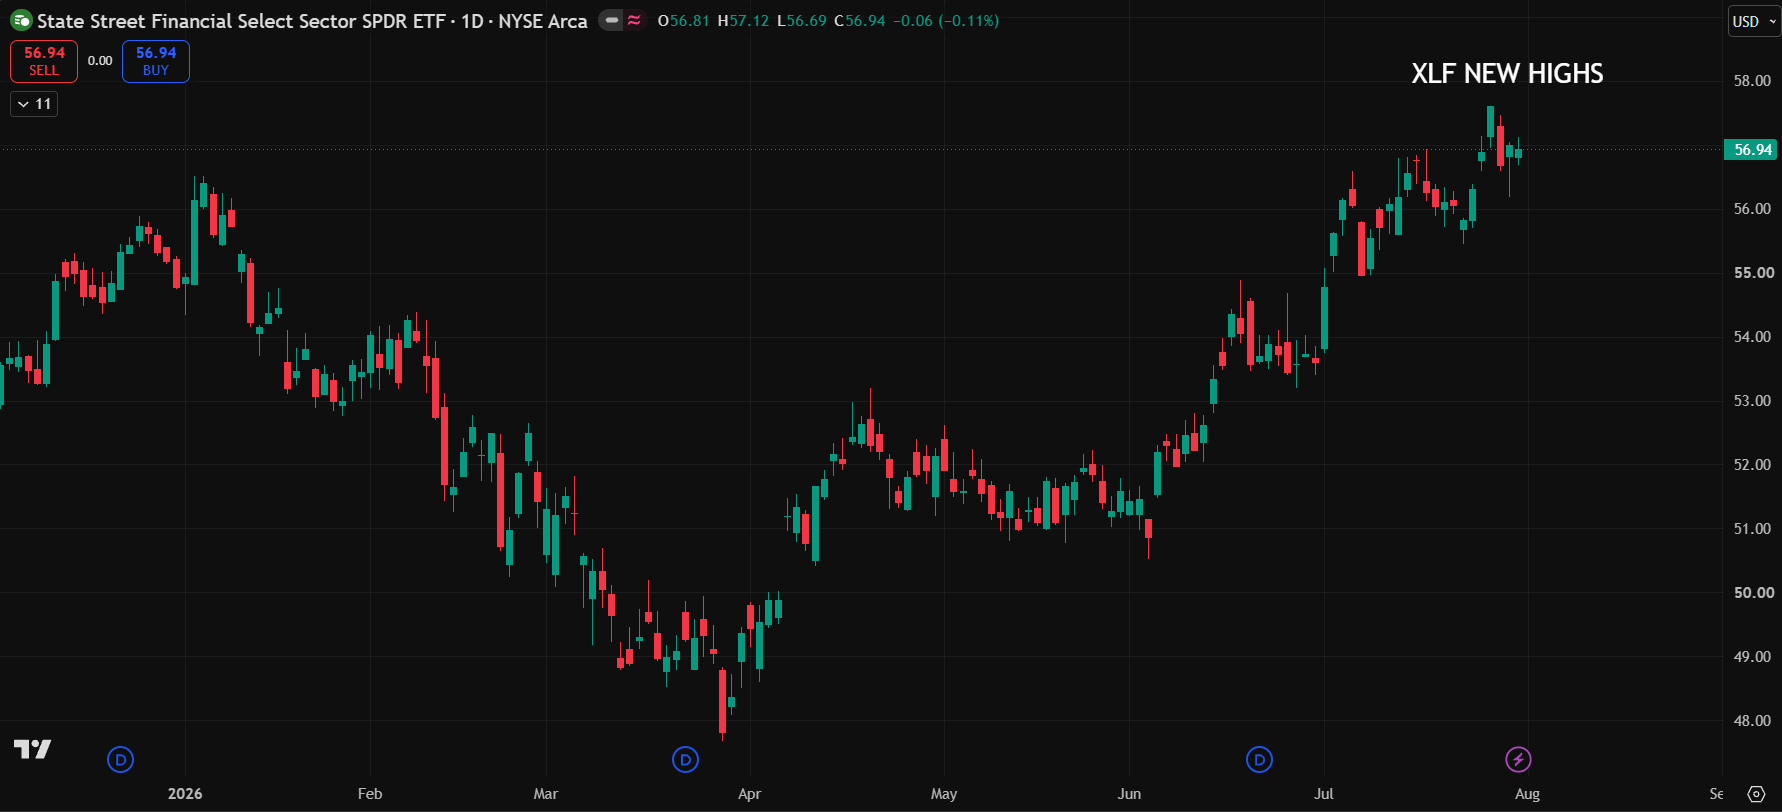
You rarely see those two groups leading while the broader market falls apart. Add strong earnings, enormous AI capital spending and deficit spending still flowing into the economy, and the trend remains up.
August Rarely Makes It Easy
I am not expecting a straight line higher from here.
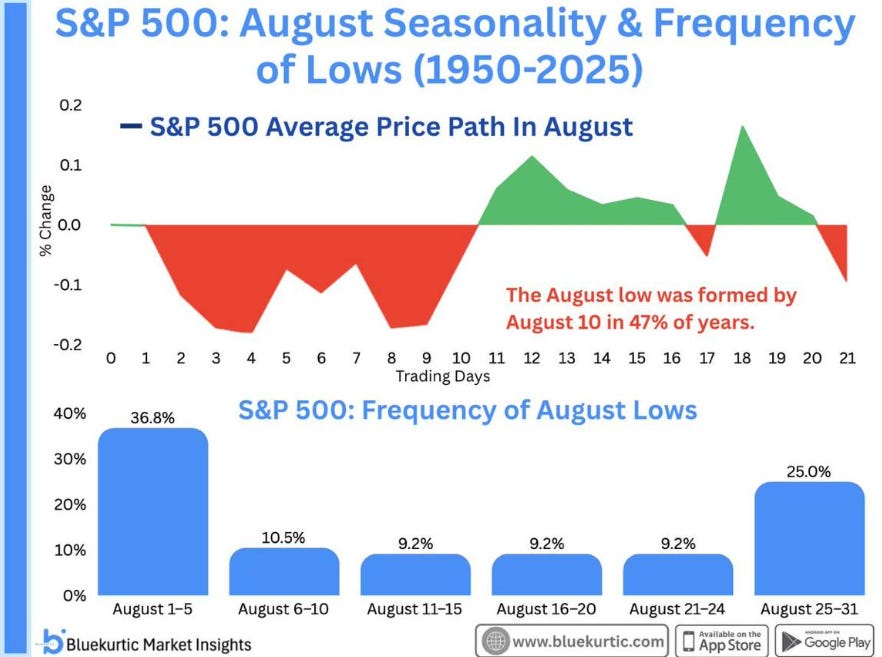
August seasonality is weak early. Going back to 1950, the average path drifts lower through the first 10 trading days before turning up. The August low was already in place by August 10th in 47% of years, and 36.8% of all August lows formed in the first five days of the month. A second cluster shows up late, with 25% of lows arriving between the 25th and the 31st.
Weakness first. Strength later.
The Correction Nobody Should Panic About
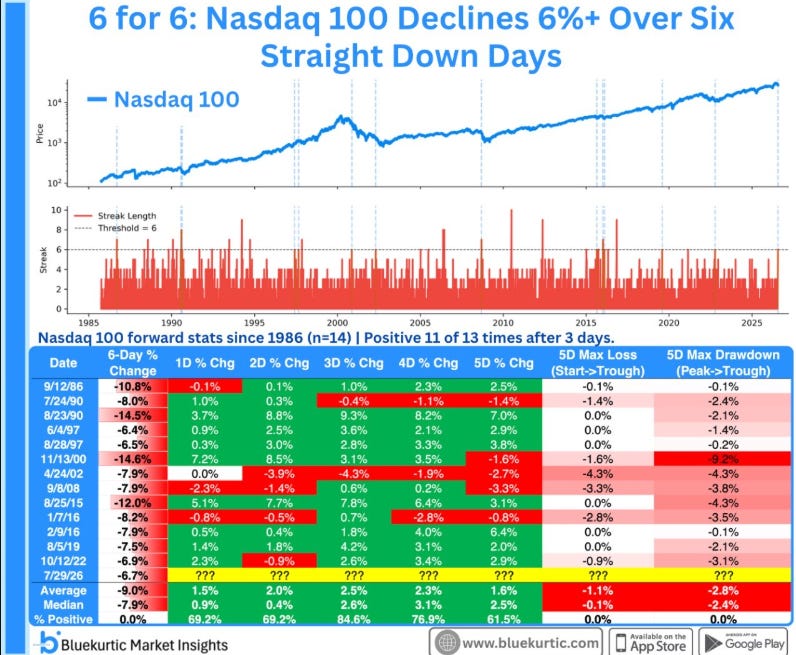
The Nasdaq 100 took 57 days to fall 10% from its all time high. Slow corrections feel worse than fast ones because they grind on you day after day.
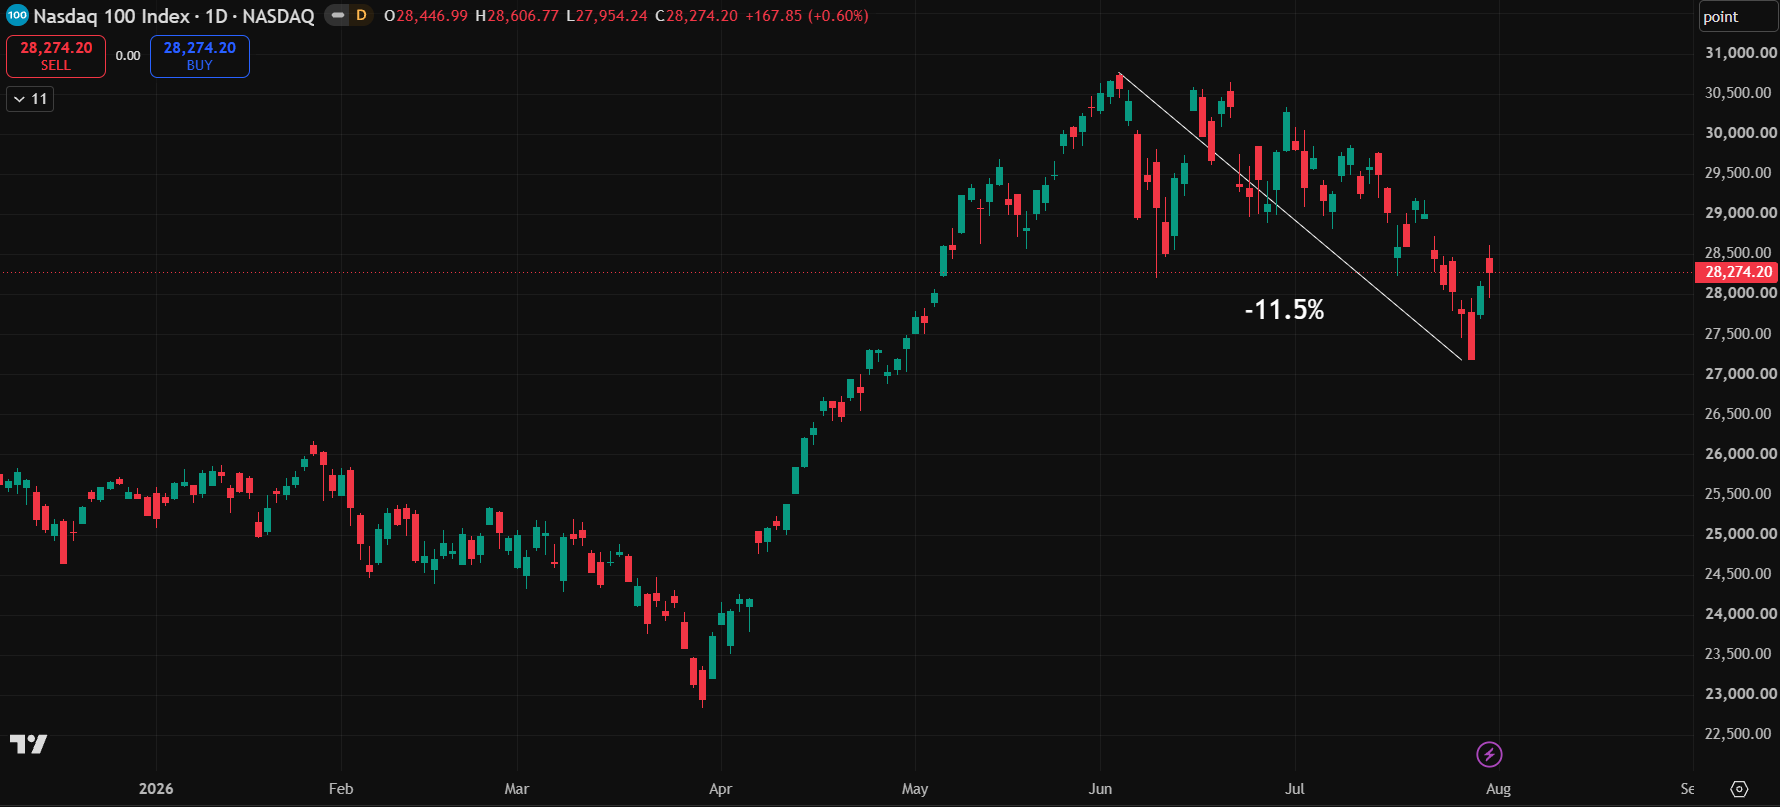
Since 1986 there have been 13 cases where a 10% correction began more than 30 days after a new high. Only two of them turned into 20% bear markets. The median time to the bottom was 25 days. Three months later the index was higher 75% of the time. Twelve months later it was higher 83% of the time, with an average gain of 23.5%.
Two Stats Worth Keeping in Front of You
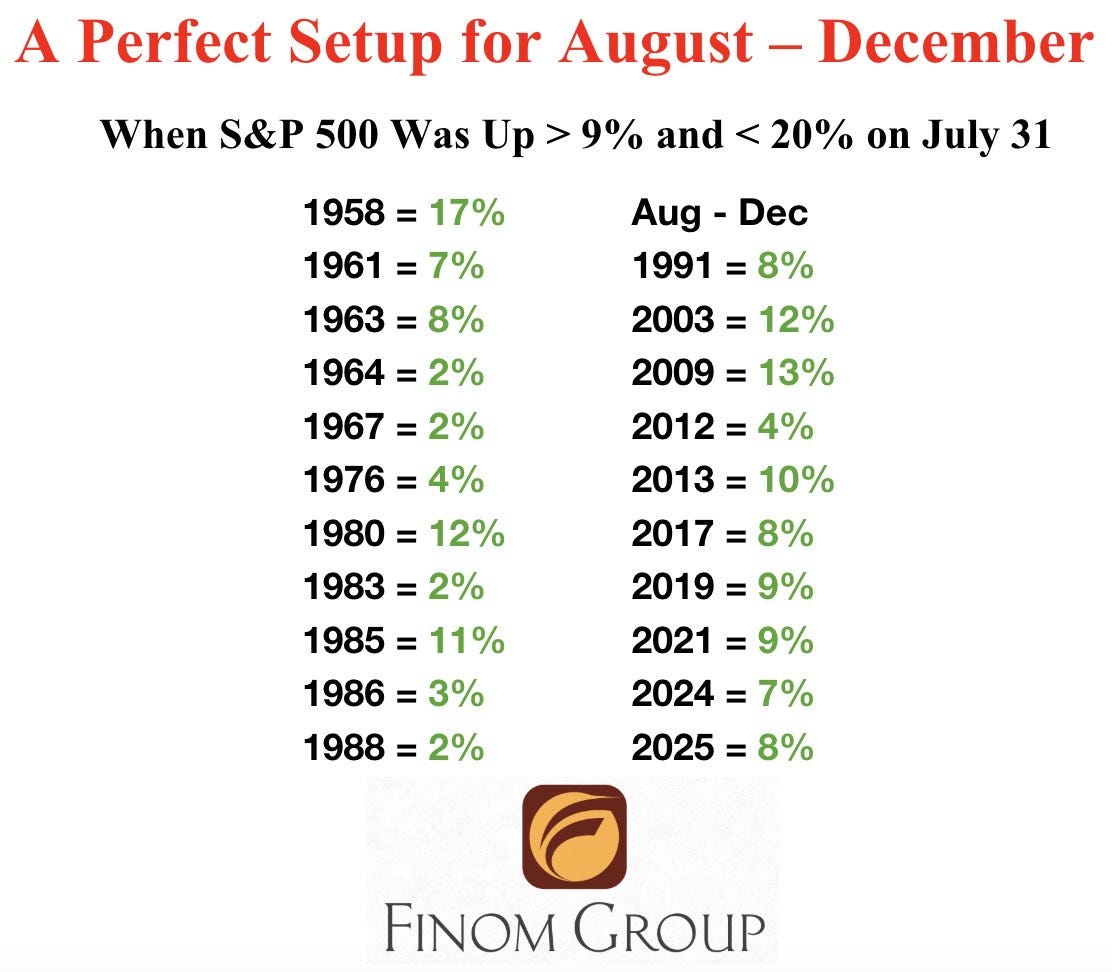
When the S&P 500 finished July up more than 9% but less than 20%, the August to December stretch has been positive every single time. Twenty one instances, average gain around 7.5%.
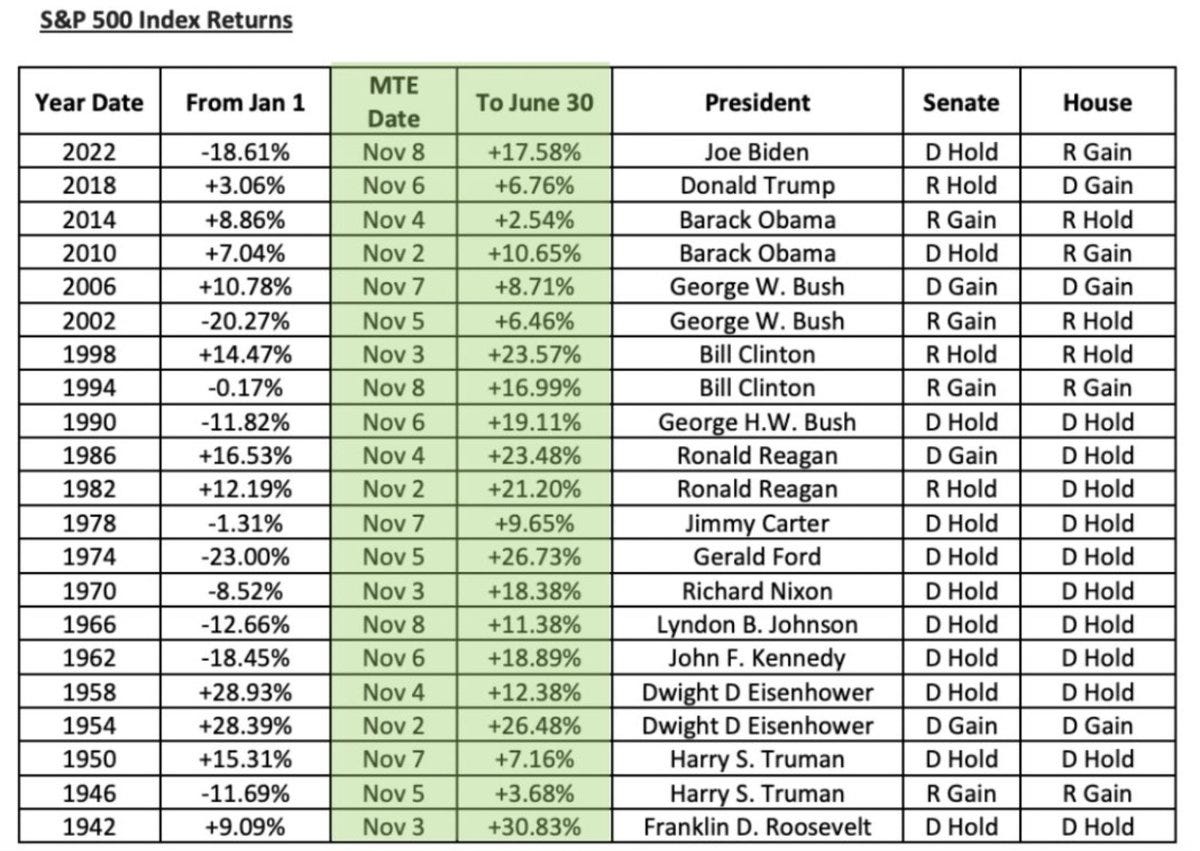
And 2026 is a midterm year. If you bought on midterm election day and held through June 30th of the following year, the S&P was higher every single time. Average return around 16%. The worst outcome was still positive at 2.5%.
Nothing is guaranteed. But when the macro signals are this mixed, I would rather lean on records like those than on how the last two weeks felt.
Bitcoin Is in the Doldrums
Bitcoin has now closed below its 200 day moving average for 270 straight days. That is the fourth longest streak ever recorded, behind only 2018, the 2022 decline and 2014.
Here is what that history shows. Across the eleven completed streaks of 30 days or more, three month forward returns were close to a coin flip: six positive, five negative. Twelve months out, nine of eleven were positive, several of them by triple digits.
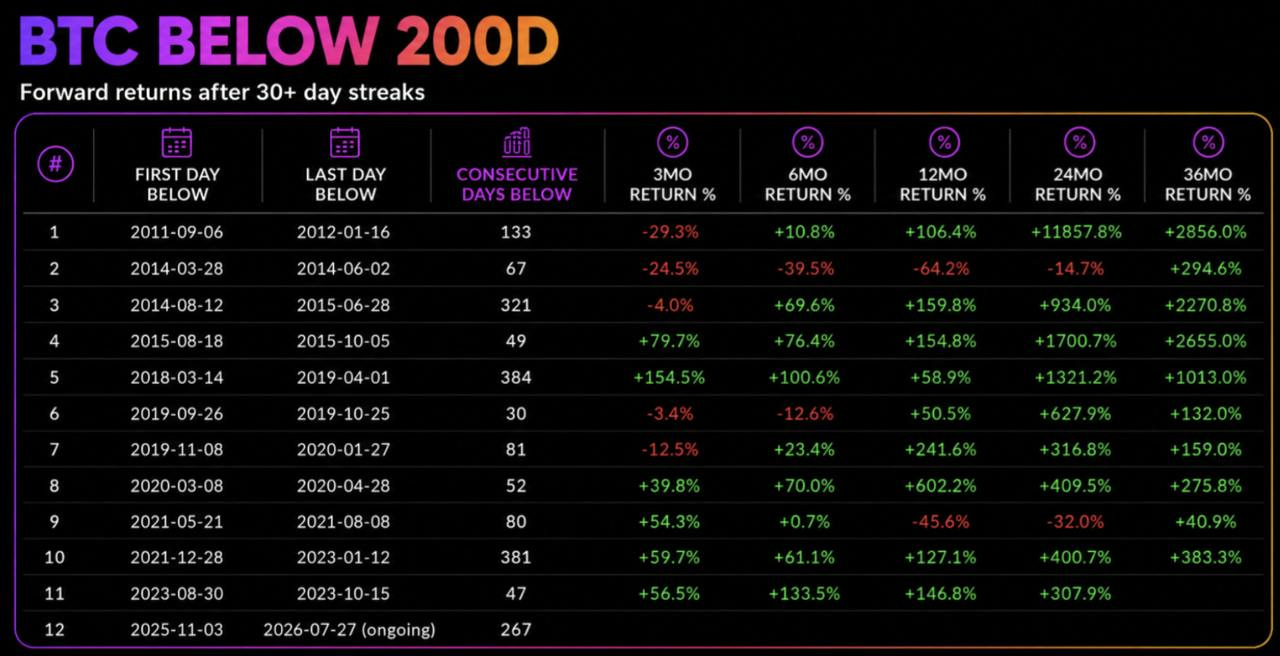
The short term offers nothing. The longer term offers a lot. That is exactly why I am adding in layers rather than all at once.
Nobody cares about this space right now. Sellers look exhausted, but no real buyers are stepping up either. And if equities give us that early August weakness, Bitcoin gets dragged along with it.
What I want to see is a flush into the low $60,000s that holds, followed by a reclaim of $67,000. That would give me the clean look I need before sizing up properly.
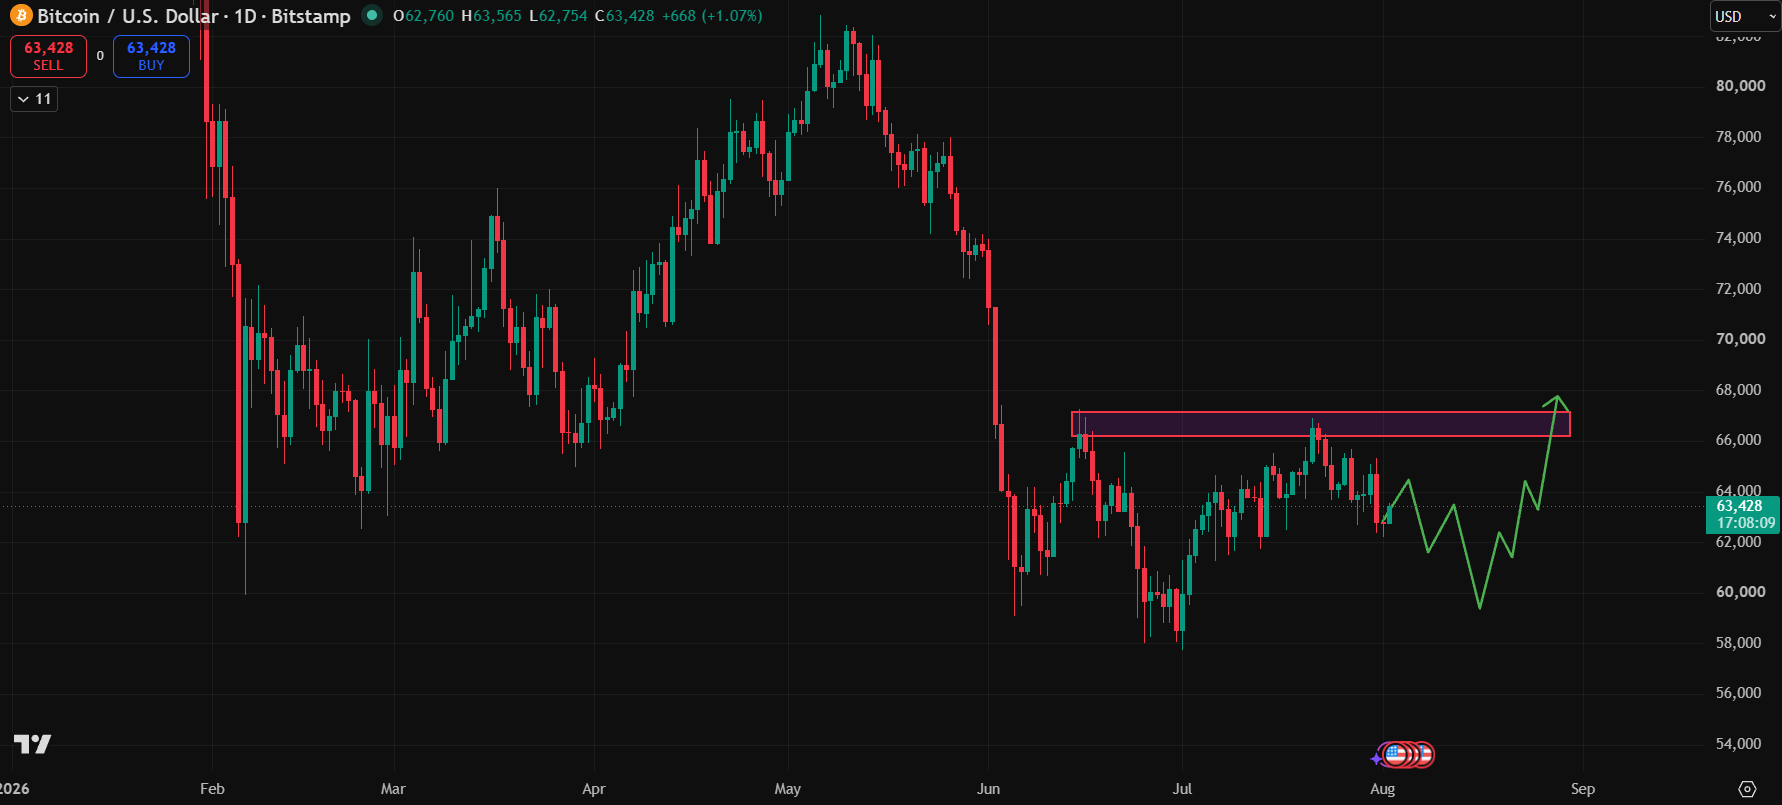
I’ll keep adding to Bitcoin in small pieces on lower levels and hold plenty back. The setup into year end and into next year is better than anything the last two weeks would have you believe.
PS… Want the complete shortcut to trading altcoins with precision (without wasting months on trial-and-error)?
Click here to grab the Altcoin Profit Toolkit — 8 structured modules + 3 indicators including the Smart Exit Decoder that shows overbought conditions on multiple timeframes, helping you scan, enter, and exit trades like a pro trader.
Written by Timothy Assi, an Elite Popular Investor on eToro.
Not investment advice. eToro is a multi-asset investment platform. Your capital is at risk. For information and educational purposes only.
Copy Trading does not amount to investment advice. The value of your investments may go up or down. Your capital is at risk.
Connect with me on:
🟦 Linkedin: Timothy Assi
🟪 Instagram: @panic_drop
⬛ X: @timoassi
📧 timothy@panicdrop.com
🟩 Panic Drop Podcast : on your favorite streaming app