

Unlock Two Free Indicators to Boost Your Investing Game

Hey there!
You're here because you're serious about leveling up your investing skills—and I’m here to help you do it fast. Today, I’m giving you two exclusive TradingView indicators designed to simplify decision-making and maximize returns.
Whether you’re a beginner, a swing trader, or a long-term investor, these tools will help you spot market opportunities with confidence.

1️⃣ Panic Drop Bull/Bear Market (S&P 500)
💡 What It Does:
This indicator identifies bull and bear markets using the 50-period and 150-period Simple Moving Averages (SMAs).
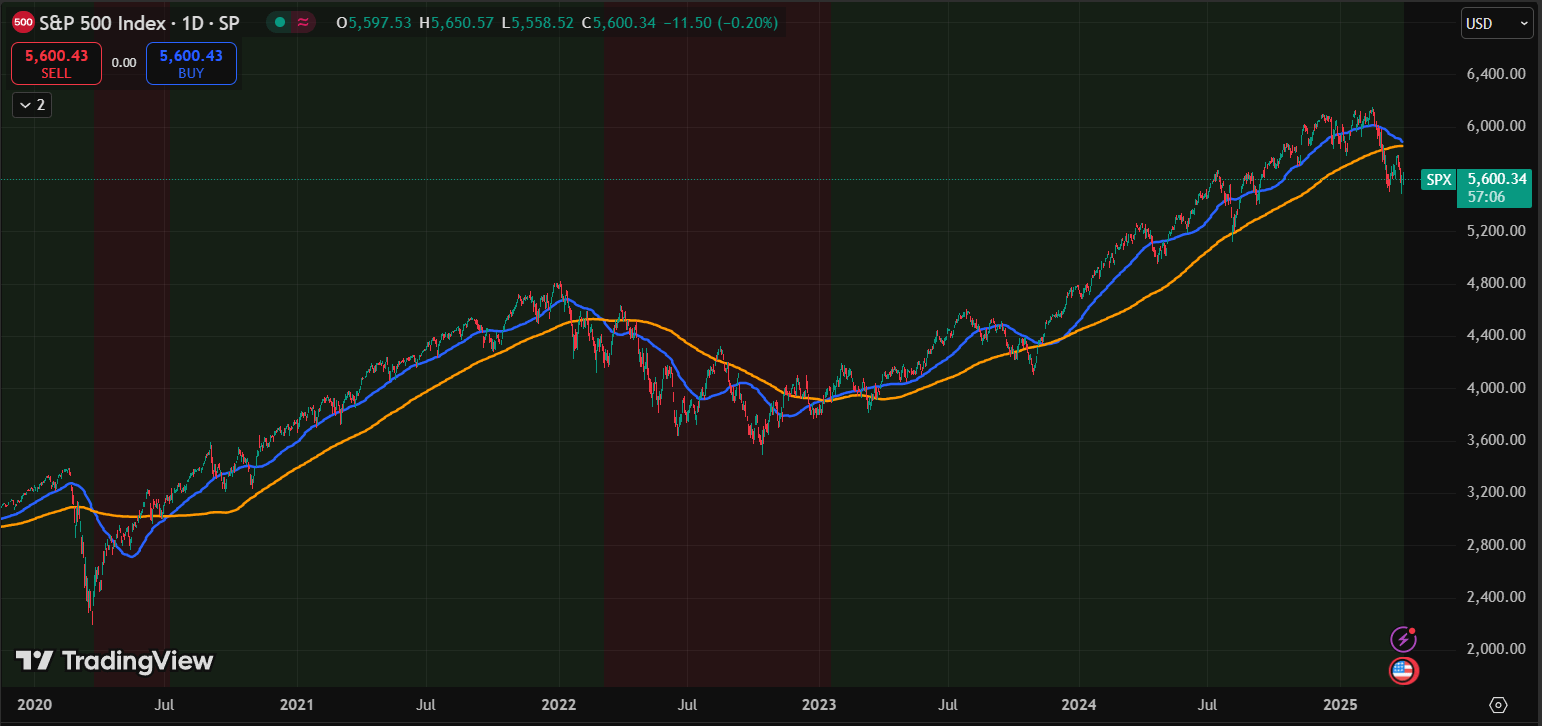
✅ Green background = Bull market (50 SMA above 150 SMA, with a flat or upward slope).
❌ Red background = Bear market (50 SMA below 150 SMA, with a downward slope).
📊 Key Features:
✔️ Plots 50 SMA (blue) and 150 SMA (orange) for clear trend direction.
✔️ Alerts for trend changes so you never miss a shift.
✔️ Fully customizable settings: MA periods, slope sensitivity, colors.
🔍 How to Use It:
Best for S&P 500 (SPX, SPY) on a daily timeframe.
Green? Consider long positions or holding.
Red? Think about shorting or protecting capital.
Set alerts for “Bull Market Confirmed” or “Bear Market Confirmed.”
💎 Why It’s Great:
✔️ Beginners: Easy-to-read colors simplify market trends.
✔️ Long-Term Investors: Keeps you in major trends without noise.
2️⃣ Panic Drop Bitcoin 5 EMA
💡 What It Does:
This indicator helps you spot Bitcoin’s bull and bear markets by bringing the 5-period Exponential Moving Average (EMA) onto your montlhy chart, providing a clear, long-term trend perspective at a glance.
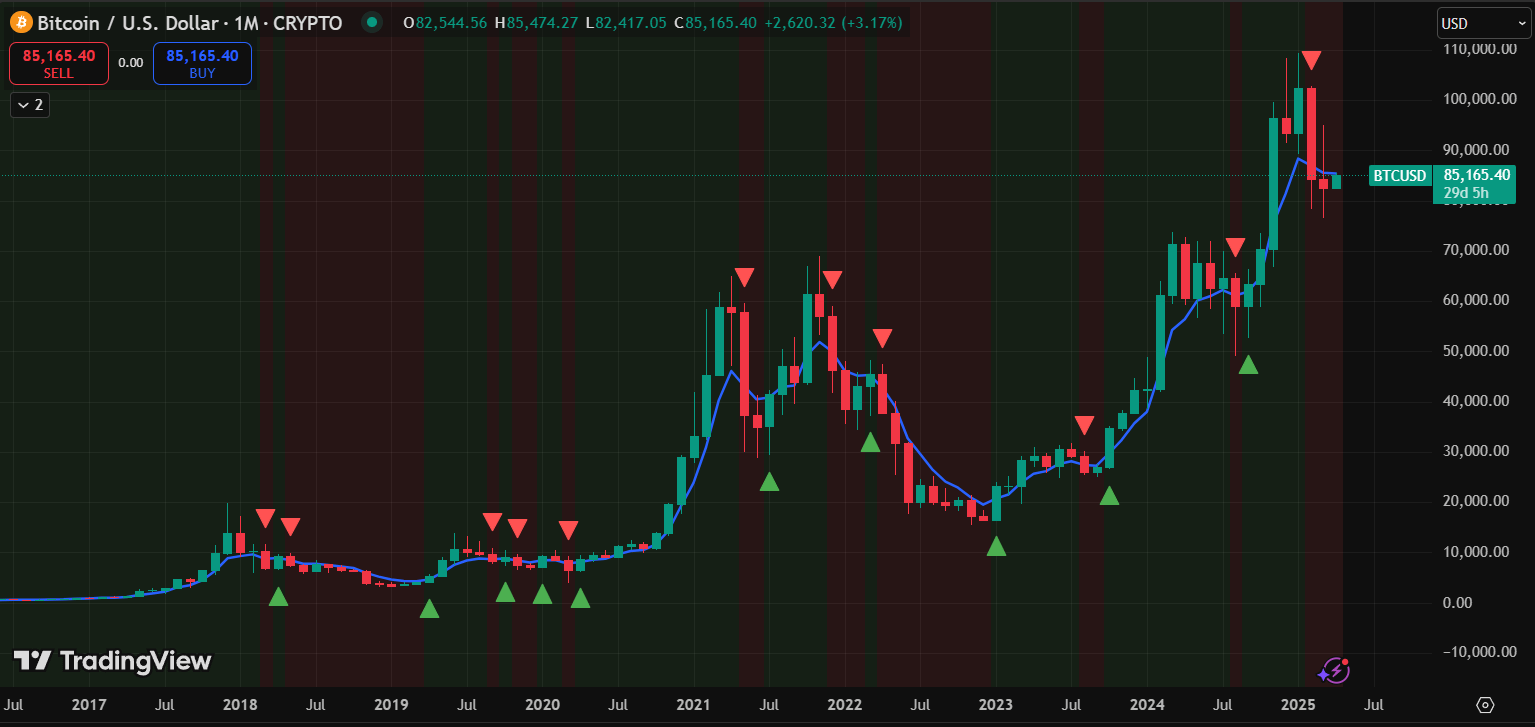
✅ Green background = Bitcoin is trading above the monthly 5 EMA (bullish).
❌ Red background = Bitcoin is trading below the monthly 5 EMA (bearish).
📈 Buy signals (green triangles) when price crosses above the 5 EMA.
📉 Sell signals (red triangles) when price crosses below the 5 EMA.
📊 Key Features:
✔️ Plots the monthly 5 EMA (default: blue line) directly on your daily chart.
✔️ Clear buy/sell signals to catch Bitcoin’s big moves.
✔️ Fully customizable: EMA period, colors, background visibility.
✔️ Alerts for buy/sell triggers so you can trade smarter.
🔍 How to Use It:
Add to your Bitcoin chart (BTC/USD or BTC/USDT) on a daily timeframe.
Green background + Buy signal? Bullish—consider buying or holding.
Red background + Sell signal? Bearish—think about selling or tightening stops.
Set alerts for “Buy Signal” or “Sell Signal” directly on TradingView.
💎 Why It’s Great:
✔️ Beginners: Visual cues make Bitcoin trends easy to follow.
✔️ Swing Traders: Fast EMA signals nail short-term moves.
✔️ Long-Term Investors: Helps you stay ahead of major Bitcoin trend shifts.
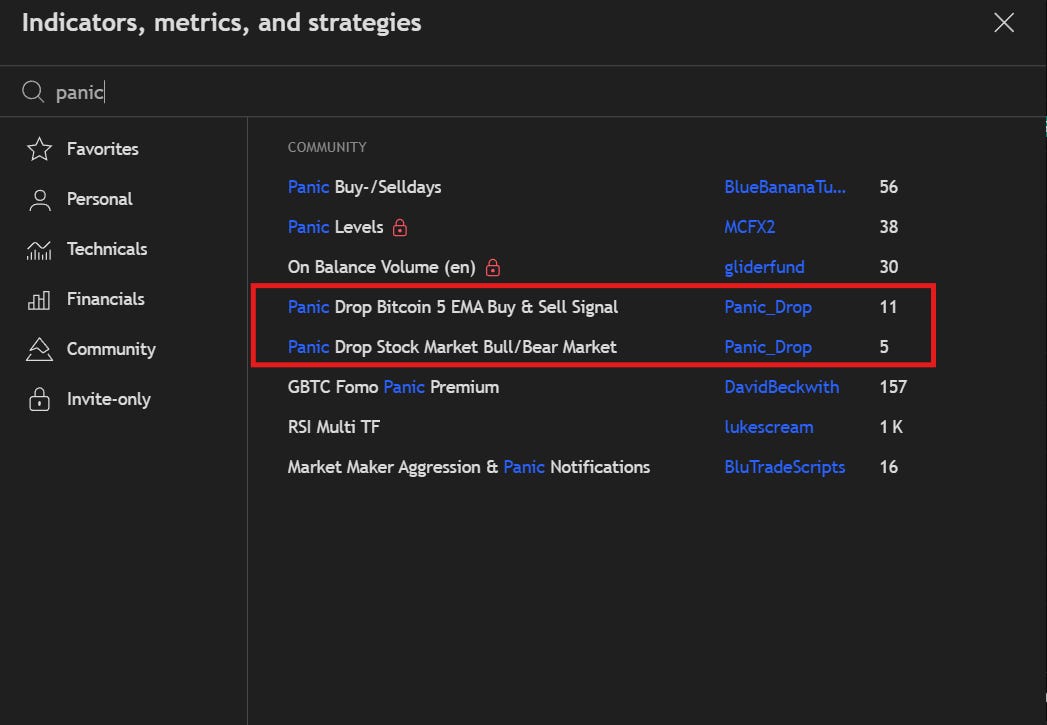
📌 How to Get These Indicators (FREE)
Getting these indicators is super easy—no downloads needed:
1️⃣ Open TradingView (tradingview.com).
2️⃣ Click Indicators (fx icon at the top).
3️⃣ In the search bar, type:
"Panic Drop Bull/Bear" (for S&P 500 & stocks).
"Panic Drop BTC 5 EMA" (for Bitcoin).
4️⃣ Click Add to Chart, adjust settings if needed, and you’re good to go!
🔥 Why These Indicators Matter
These tools help you spot market trends more easily, giving insight into Bitcoin and stock market momentum. No indicator is 100% accurate, but they can be useful for identifying potential shifts and overall direction.
They highlight key market moves based on past patterns, but like any tool, they work best when combined with other analysis.
By using these indicators in your strategy, you can get a clearer picture of market trends.
I hope you find this helpful!
Written by Timothy Assi, an Elite Popular investor on eToro.
Connect with me on:
🟦 Linkedin: Timothy Assi
🟪 Instagram: @panic_drop
⬛ X: @timoassi

The content of this email is not intended to constitute financial advice. We recommend conducting your own independent research.