

The Bargains Are Almost Gone. Here's What's Left.
Top Stocks Vault

For weeks the chant was the same. Sell in May. Take profits. The rally is tired, the AI trade is crowded, a summer pullback is coming. The loudest strategists on Wall Street, from Bank of America to Morgan Stanley, lined up to tell you the easy money was made.
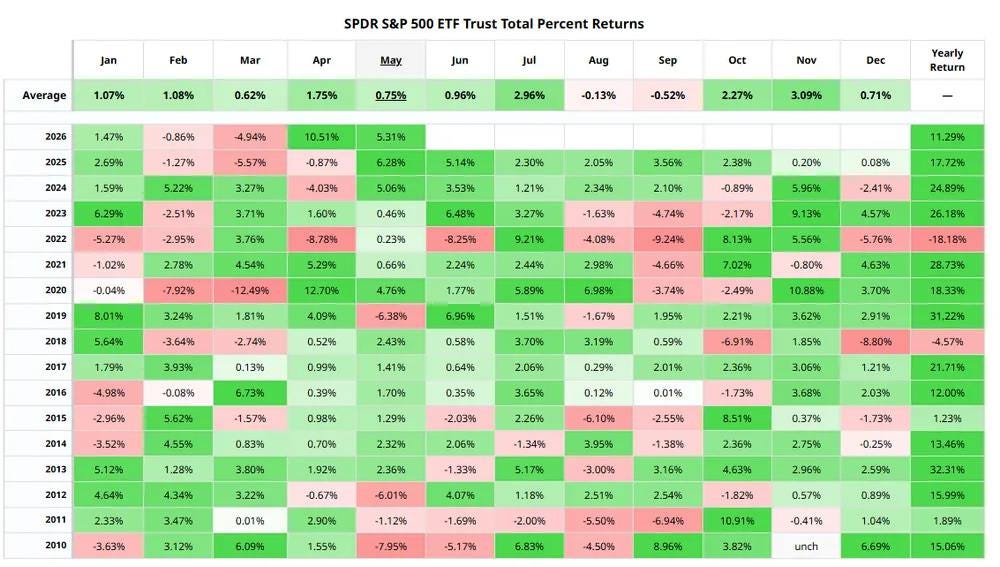
May closed up roughly 5%, and the scoreboard tells the story:
The S&P 500 sits near 7,580 at a fresh record, riding its ninth consecutive weekly gain
The Dow printed a new all-time high above 50,600
The Nasdaq cleared 26,900
The people who sold in May got steamrolled by May.
Here is the pattern almost no one is talking about, and it is the reason I stayed fully invested through the noise.
When the S&P 500 posts a negative first quarter and then rips 4% or more in both April and May, something rare is happening. Since 1950, that exact sequence has occurred only five times: 1980, 2003, 2009, 2020, and now 2026. The track record of the prior four is perfect:
Every single one finished the year positive, all four, not most
June through December never once posted a loss
The average full year delivered roughly 23%, the median nearly 25%
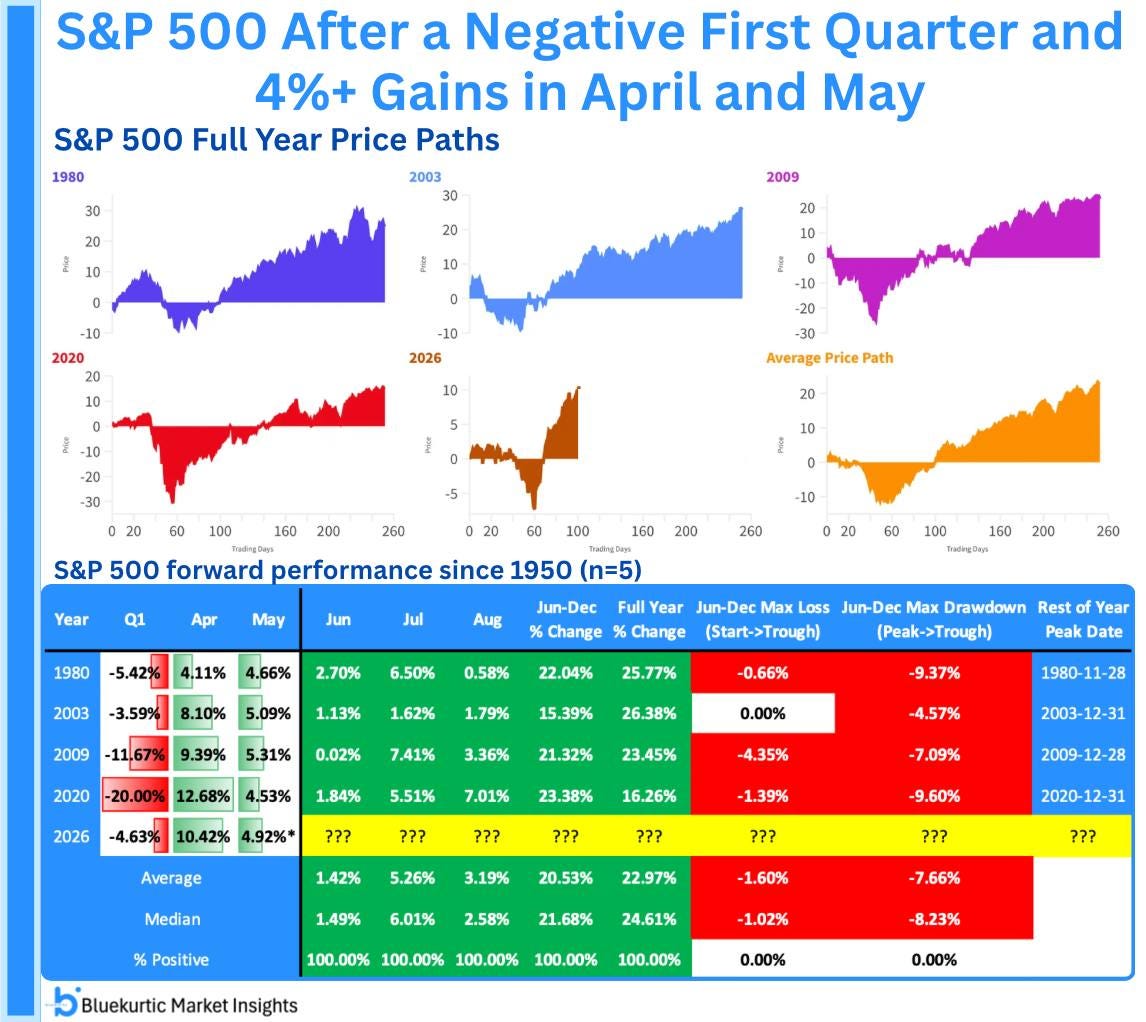
We came into 2026 down 4.6% in Q1, up 10.4% in April, and up close to 5% in May. We are now living inside the fifth case.
It gets better on the calendar. June and July together are the second-best two-month stretch the market has produced over the last fifteen years. The seasonal wind is at our backs for at least the next sixty days.
Now for the honest part, because blind bullishness wrecks accounts. The case for caution is real:
The economy is slowing, GDP growth has cooled from 2.9% in 2023 to just 1.6% so far in 2026
Tariffs have added about 70 basis points to inflation
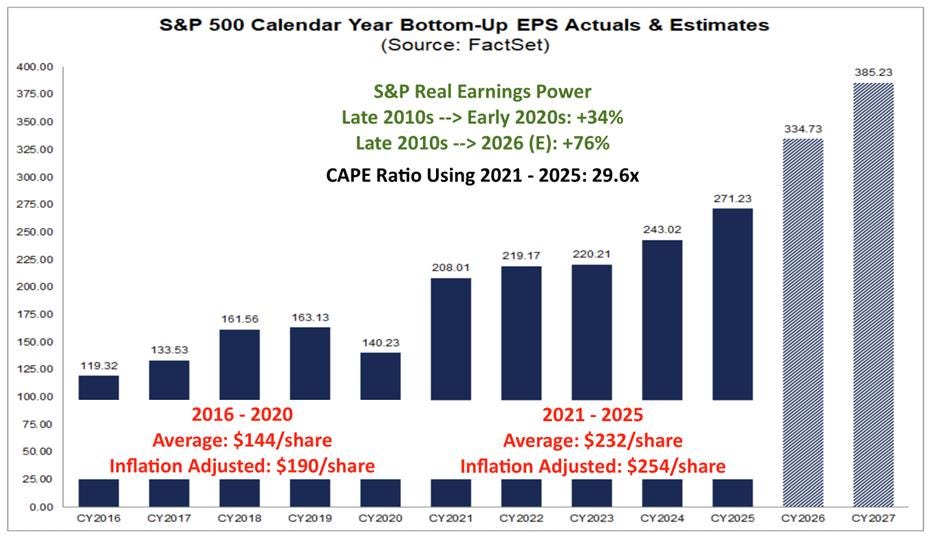
The bears keep pointing to a CAPE ratio near 29.6x as proof stocks are too expensive
But that last number is misleading. CAPE looks back ten years and misses how much earnings power has grown:
The S&P 500 earned an average of $190 per share (inflation-adjusted) from 2016 to 2020
From 2021 to 2025 it earned $254, a 34% jump
This market is being carried by real profits, not hype. Earnings are doing the work.
So what am I doing? The same thing that works every cycle: I bought quality companies at a discount during the March panic, and the rally has carried most of them right back to fair value or beyond. The strategy did its job again. I trimmed into the strength and I am holding cash for the next pullback. Only six names in the vault still trade below what they are worth.
Here’s where every position stands:
