


This summer, more Bitcoin went underwater than stayed in profit. That kind of cross has shown up before every real bottom in this asset’s history, and it is the reason the loudest voices are already calling the low.
But the same signal that opens a bottoming window does not tell you the bottom is in, and confusing the two is how people get caught early.
The green candles are back after a brutal low and price has recovered above the 200 moving average.
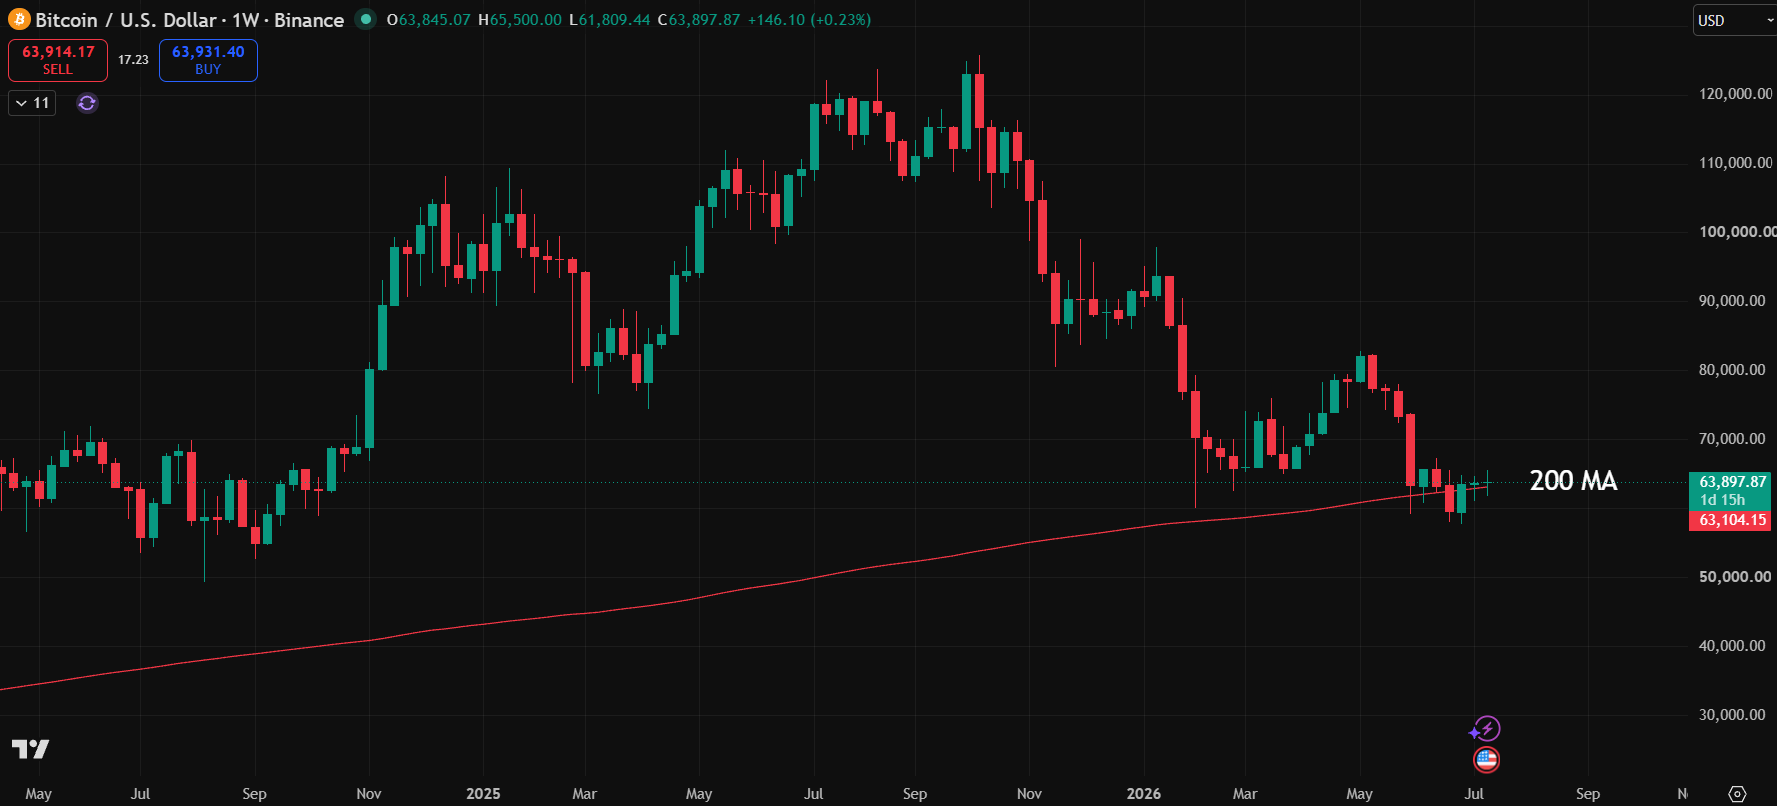
It feels like the turn. Relief just is not the same thing as resolution, and when I line up what the on-chain data is actually saying against the calendar we are sitting in, the picture that emerges is a lot more uncomfortable than the narrative suggests.
This bounce does not look like a break from the pattern. It looks like a part of it.
There is one specific year in Bitcoin’s history that this cycle keeps rhyming with, and most traders have forgotten it because it did not end in fireworks. How that year resolved tells you a great deal about where the next few months are likely to go.
Inside today’s premium breakdown, I cover:
Why reclaiming the 200-week moving average may not mean what the bulls want it to mean
The two critical pricing model floors that have marked every real Bitcoin bottom, and how far below current prices they still sit
Exactly what I am doing with my own allocation right now, level by level
The data does not care about hopium, and it does not care about fear. Let me show you what it is actually saying.
This full analysis is available to paid subscribers. Upgrade below to read the complete breakdown.
