

Buying Bitcoin in June? These Stats Could Make or Break Your Trade

As we kick off June, Bitcoin hovers around the monthly open—and the big question is simple: pullback first, or straight to new highs?
Whether you're looking to buy the dip or time an exit, this breakdown of June’s historical behavior can give you an edge. Let’s cut through the noise and focus on what the data says, where the real opportunities lie.

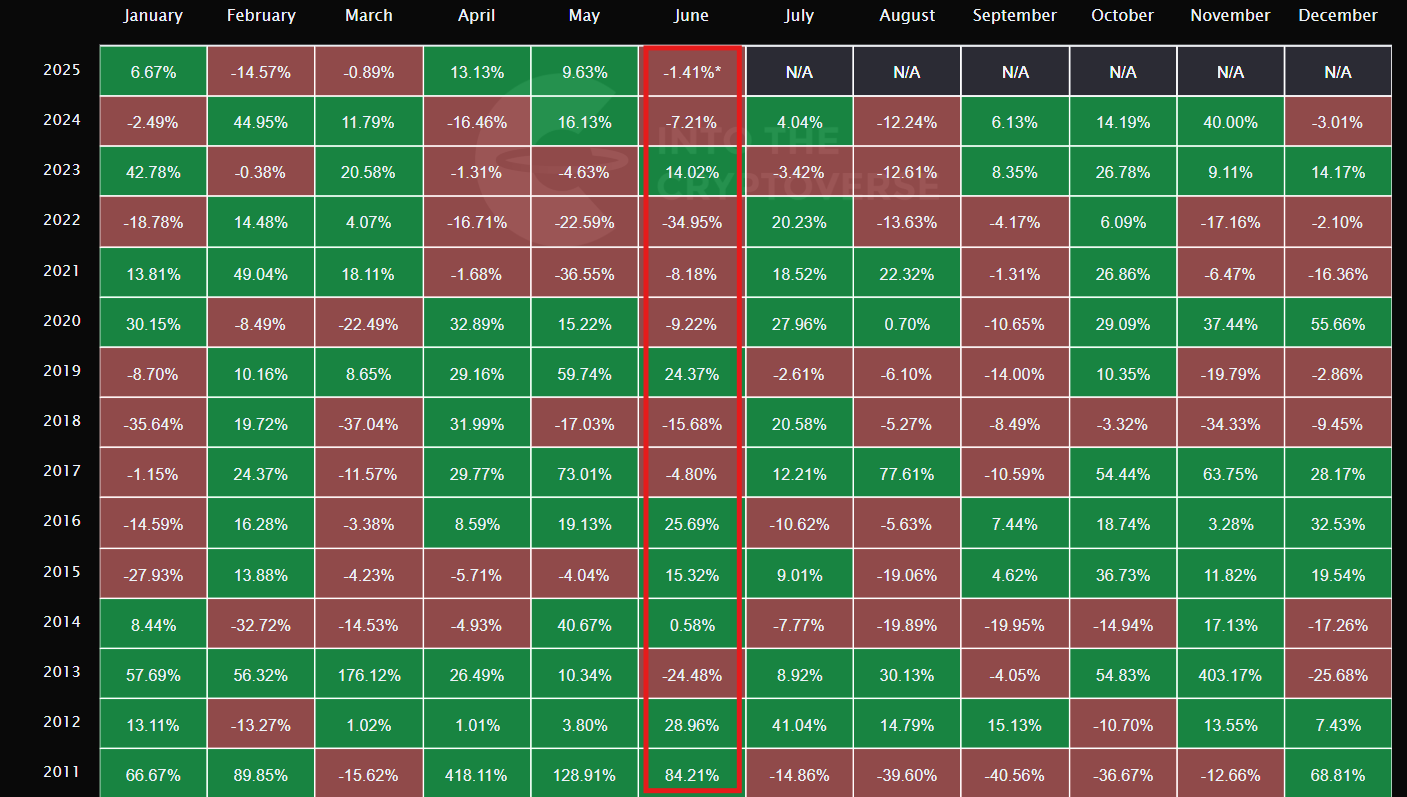
📊 June: Notoriously Unpredictable
Out of the last 14 years:
✅ 50% of Junes closed green
❌ 50% of Junes closed red
Translation: June is basically a coin flip. You can’t blindly assume continuation.
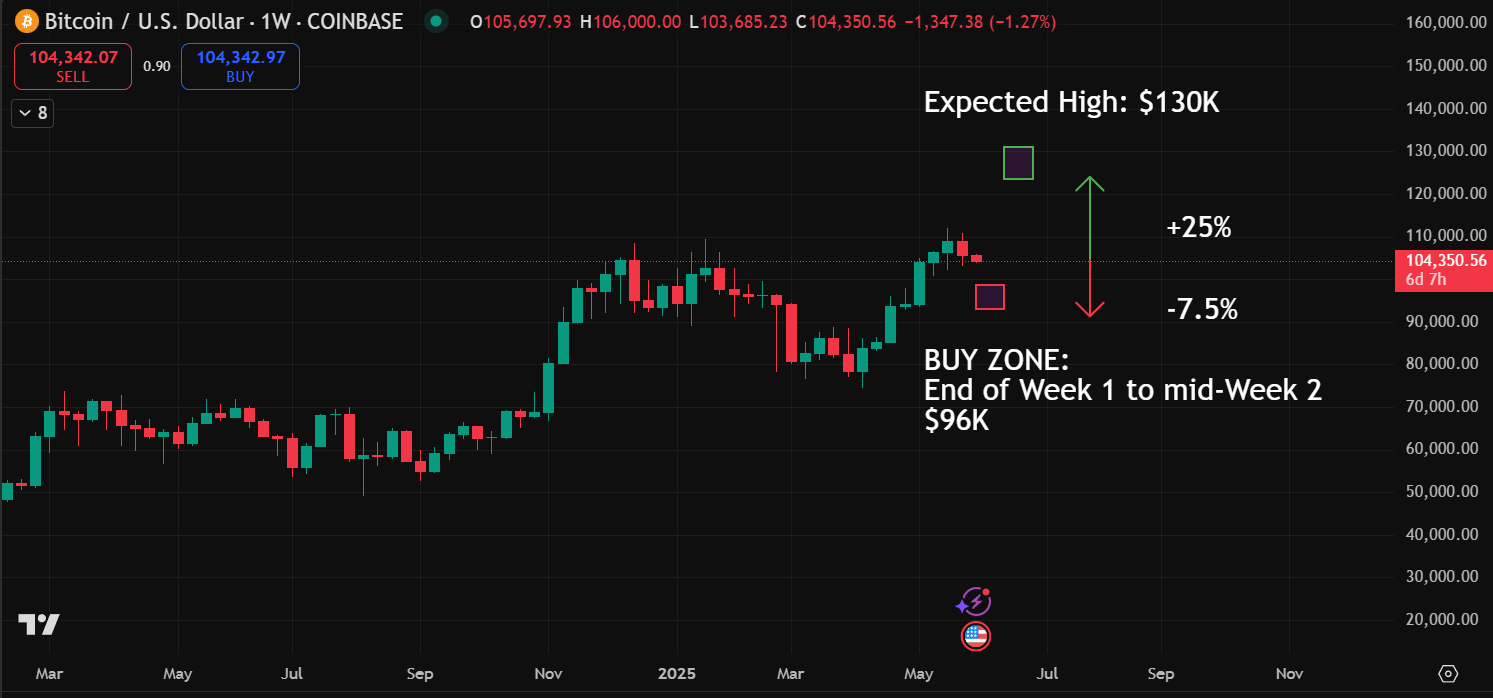
🟢 If June Closes Green (Bullish Scenario)
Average Return: +25%
Typical Dip Before Rally: –7.5% below open
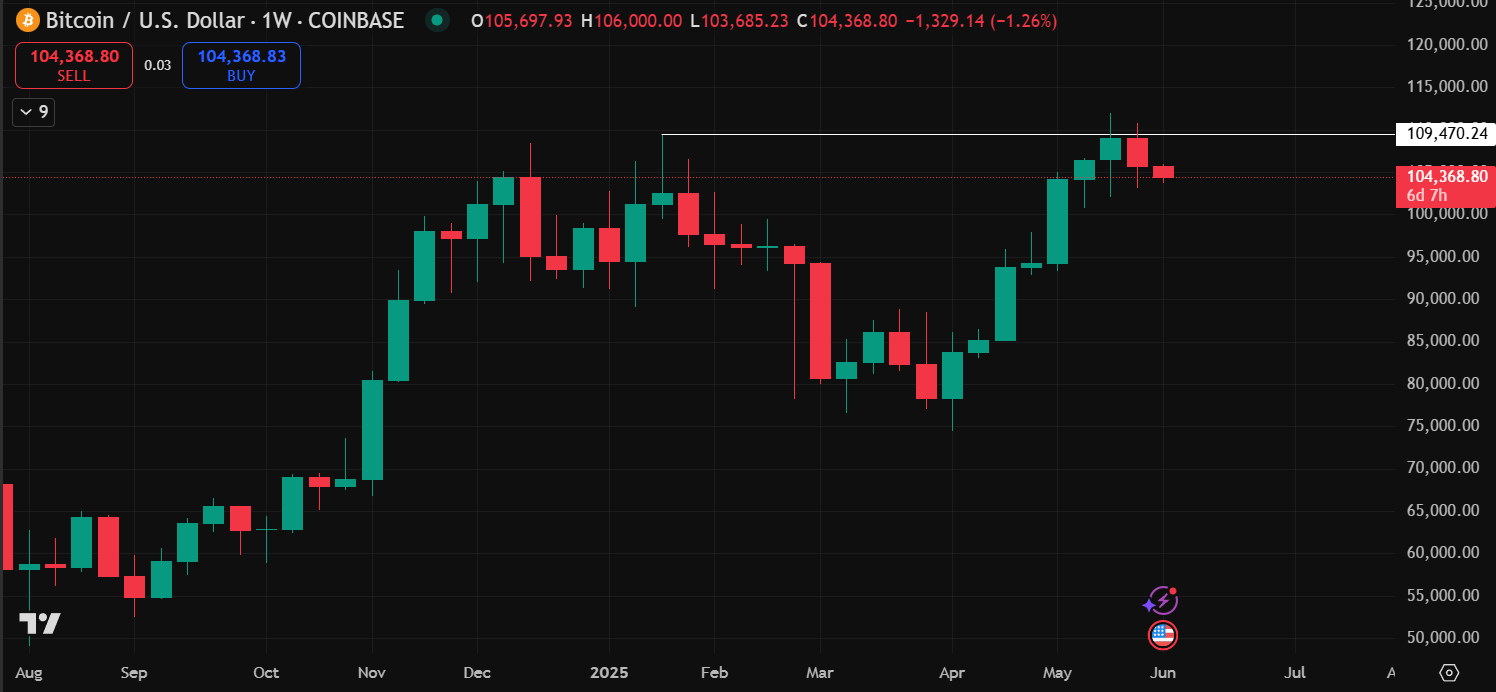
🎯 Expected High: BTC opened June near $104,645, a historical +25% rally targets $130K.
🕒 When Does the Low Happen?
→ Most bullish Junes hit their low between Day 7 and Day 14 (i.e. end of Week 1 to mid-Week 2).
→ This gives bulls a clean entry window after the first week.
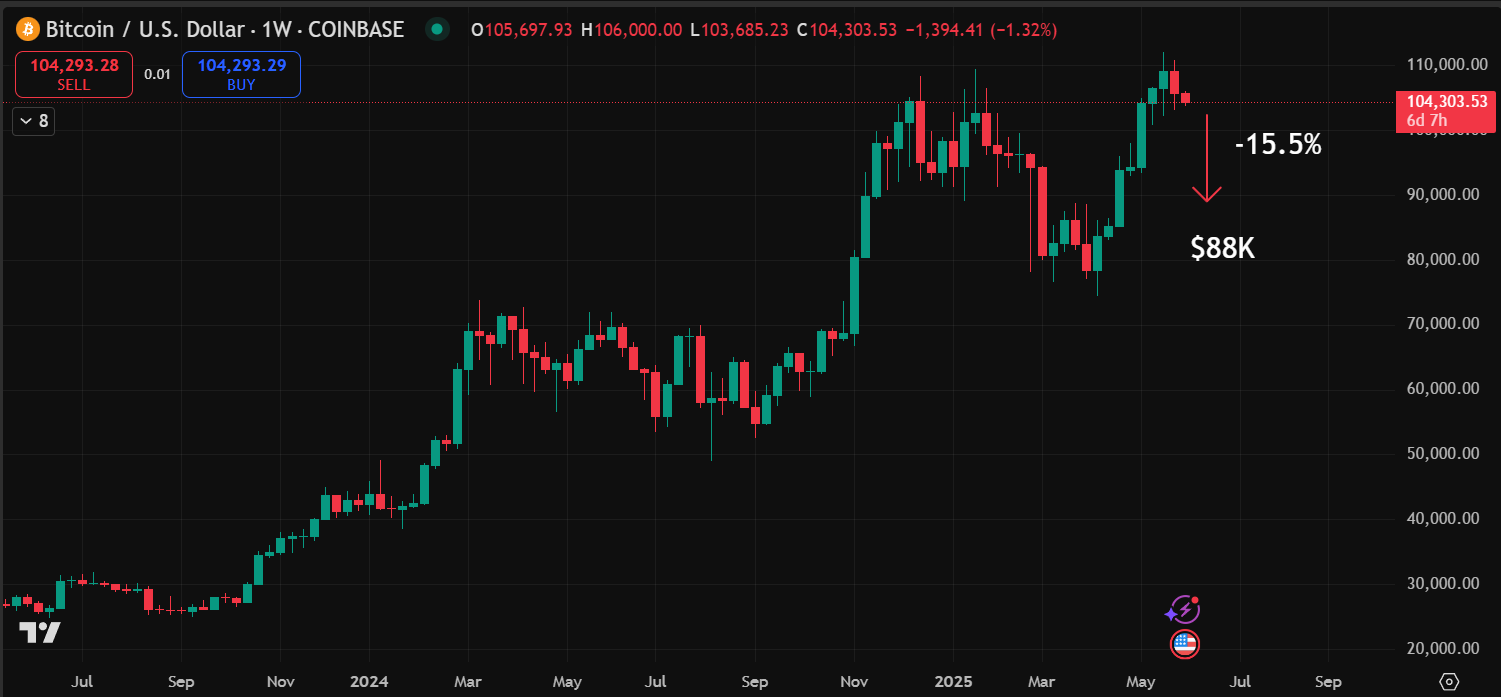
🔴 If June Closes Red (Bearish Scenario)
Average Drawdown: –15.5%
Worst Case Drop: –23%, targeting the mid-$80Ks
Expected High: Comes early—usually before Day 5
Expected Low: Hits late—around Day 23
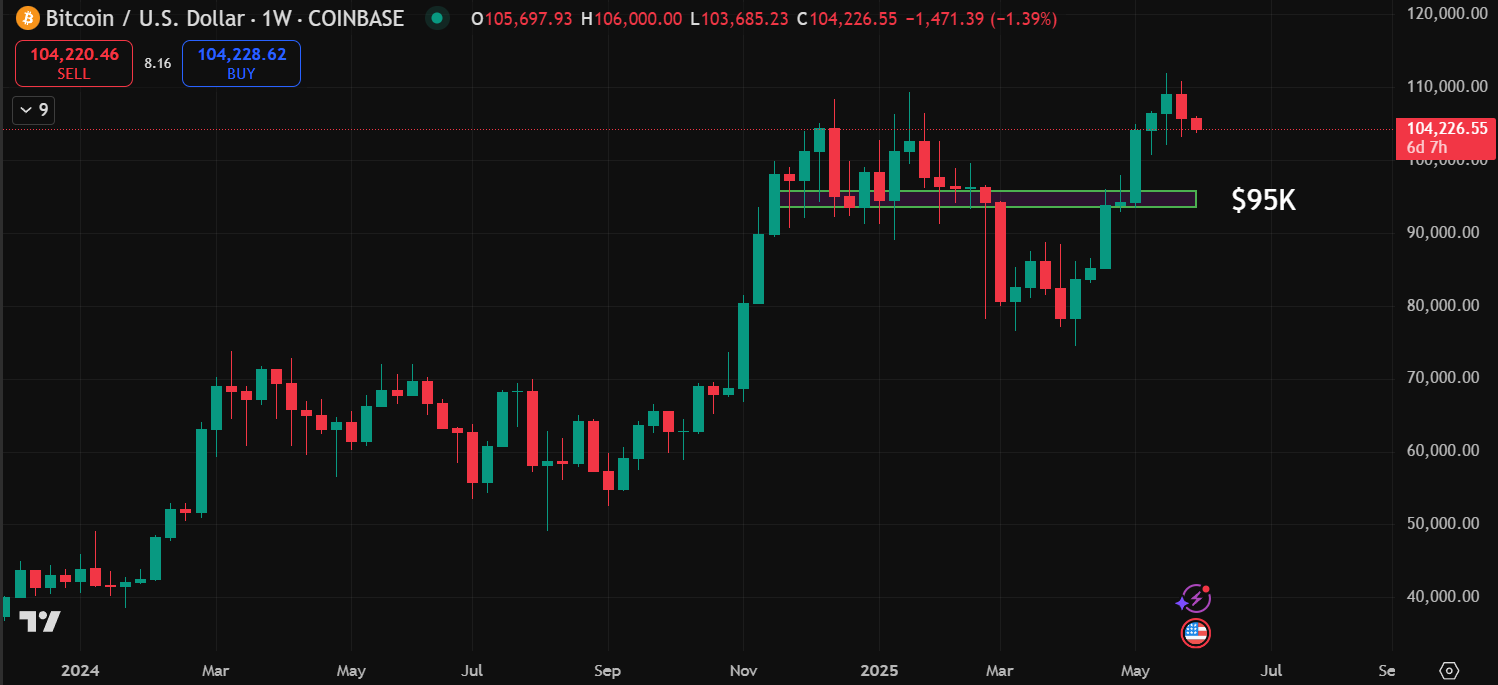
🧠 Key Takeaways
✔️ Wait for a pullback. Don’t FOMO in Week 1.
✔️ Watch the $95K area. If we drop there, it’s a high-probability bounce zone.
✔️ Bullish above Week 1 high. Closing Week 2 above this high keeps the green June narrative alive.
✔️ Expect a fake-out. Even bullish Junes start with a shakeout. Stay patient.
⚠️ Chart Warning: Bitcoin Confirms Double Top
Let’s address what just happened on the chart:
Bitcoin has confirmed a double top, which is a classic bearish pattern.
That confirmation came after price pushed above the January high—and closed below that level. From a technical standpoint, this increases the probability of a downmove.
💼 Portfolio Move:
After confirmation of the double top, I decided to reduce my Bitcoin exposure by 5%. This isn’t panic—it’s just proactive risk management & taking some profits (I still hold 5%).
If Bitcoin trades back above $112,000 without a deep correction, this double-top setup becomes invalid, and I can re-enter.
🔄 Ethereum Says: “Not So Fast”
While Bitcoin flashes weakness, the ETH/BTC chart just confirmed a double bottom — the exact opposite.
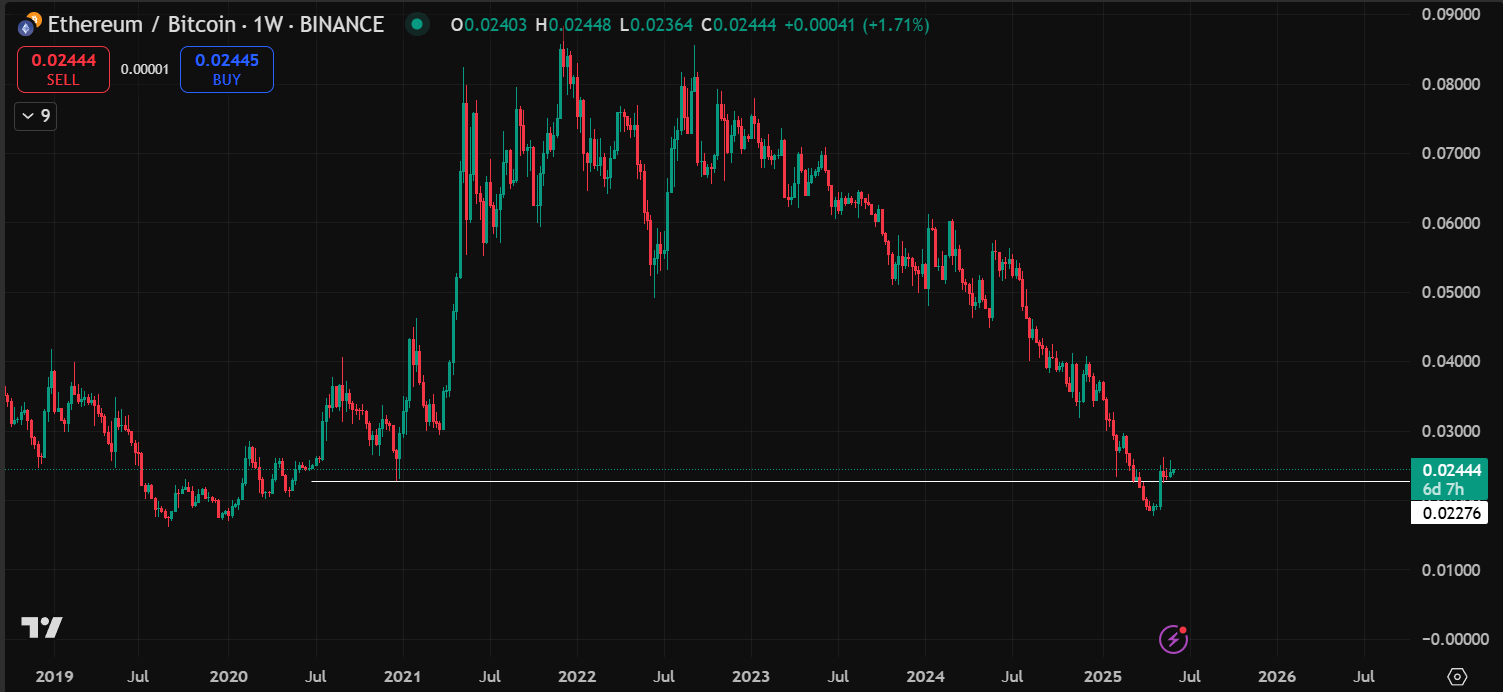
📈 That’s a bullish signal for Ethereum — and for altcoins more broadly.
What does this mean?
The market may be rotating into Ethereum and alts.
Altcoins could outperform BTC in the coming weeks.
I’m shifting my focus and looking to add more altcoins instead of stacking BTC here.
📘 The altcoins I’m eyeing are detailed in this week’s Top Altcoin Playbook — including entries, setups, and targets.
Thanks for reading
PS… Want the complete shortcut to trading altcoins with precision (without wasting months on trial-and-error)?
Click here to grab the Altcoin Profit Toolkit — 8 structured modules + 3 indicators including the Smart Exit Decoder that shows overbought conditions on multiple timeframes, helping you scan, enter, and exit trades like a pro trader.
Written by Timothy Assi, an Elite Popular Investor on eToro.
Not investment advice. eToro is a multi-asset investment platform. Your capital is at risk. For information and educational purposes only.
Copy Trading does not amount to investment advice. The value of your investments may go up or down. Your capital is at risk.
Connect with me on:
🟦 Linkedin: Timothy Assi
🟪 Instagram: @panic_drop
⬛ X: @timoassi
📧 timothy@panicdrop.com
🟩 Panic Drop Podcast : on your favorite streaming app